Page 4 – Dwyer AFG User Manual
Page 4
Instrumentation and Completing the System:
The AFG Flow Grid is not a complete measuring system. To com-
plete the system it is necessary to convert the output signal into a
more useful form.
For occasional checking of the AFG Flow Grid, differential pressure
portable instruments may be used.
A pressure transmitter may be used to give an electrical output
proportional to the pressure signal or include a square rooting
function to indicate velocity directly.
If the AFG Flow Grid is to be used as part of an alarm system, to
warn for example, if the volume flow rate drops below a certain
limit, a manometer fitted with alarm trips may be used.
To complete the installation, fit flexible tubing from the elbows at
the ends of the AFG Flow Grid to the chosen instrument. The
elbow connector is 6 mm outside diameter.
Interpretation of Output:
Duct mean velocity:
The differential pressure signal obtained across the output tap-
pings of the AFG Flow Grid is proportional to the duct mean veloc-
ity pressure and to the square of the duct mean velocity.
The relationship between the differential pressure and the velocity
pressure is the magnification factor M.
M= (ΔP)/(Pû)
AFG Flow Grid: M=1.0
Table 3: Calculating Velocity from Differential Pressure
Volume Flow Rate:
The most useful information obtainable from an AFG Flow Grid is
the volume flow rate in the duct in which it is fitted.
Table 4: Calculating Volumetric Flow from Differential Pressure
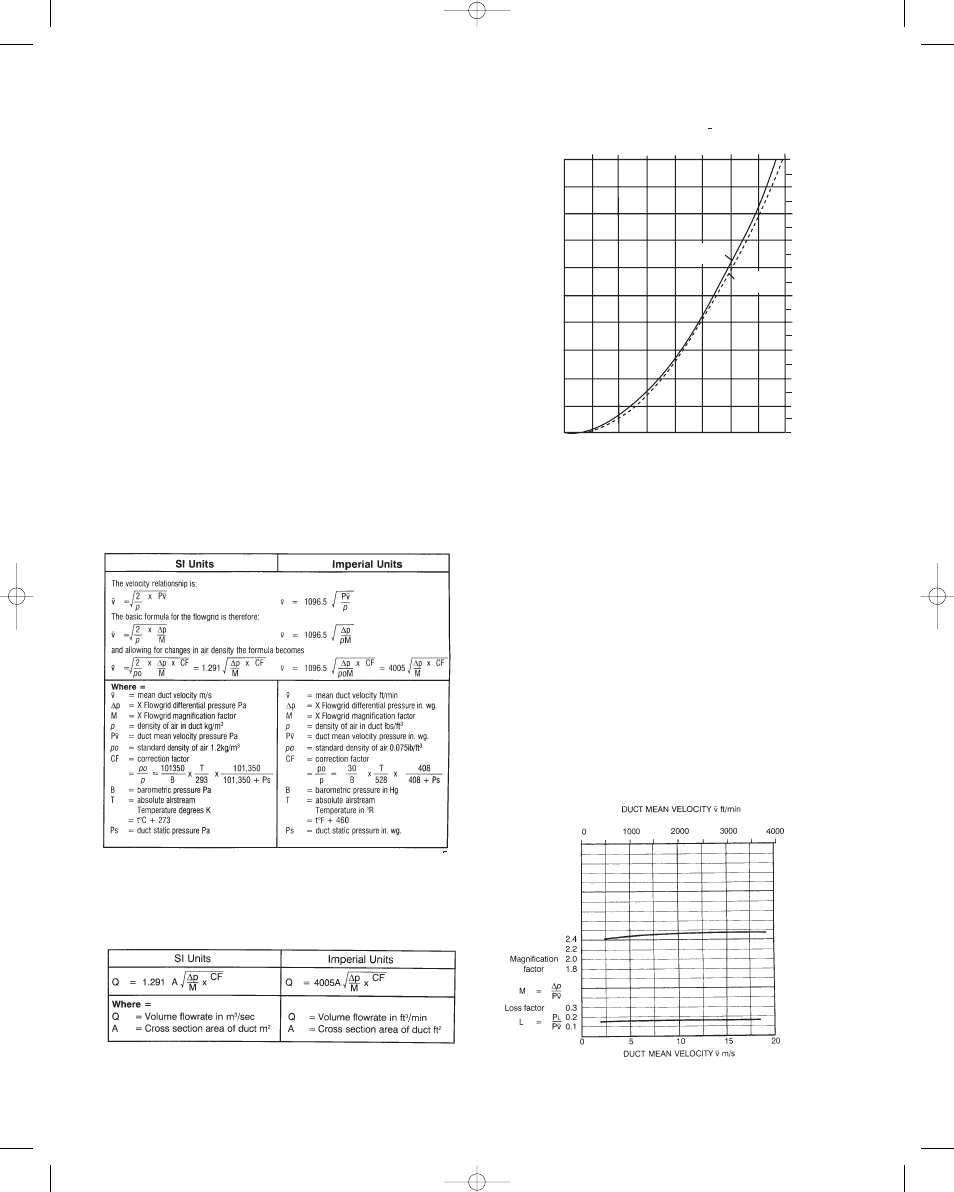
Fig. 14: Typical Performance Graphs
Fig. 14 (above) shows AFG Flow Grid differential pressure against
duct mean velocity.
This graph is drawn for standard air conditions of 1.2 kgs/m
3
(0.075 lbs/ft
3
) and may be used if lower levels of accuracy (See
page 1 & 3) are acceptable. If higher levels of accuracy are required
on site calibration is essential (See next page).
Losses:
Introducing an AFG Flow Grid into a duct causes a very small pres-
sure loss, which should be known when calculating the energy
requirements in a ducted system. The loss is measured as the
pressure drop between tapping points situated D/2 upstream and
downstream of the grid.
Fig. 15 shows magnification factor M and pressure loss factor L
plotted against mean velocity for a typical AFG Flow Grid installa-
tion. It will be seen that these values remain sensibly constant over
the useful range of the AFG Flow Grid.
Fig. 15: Magnification and Pressure Loss Factors
page 4
500
400
300
200
100
0
0
5
10
15
20
0
0.5
1.0
1.5
2.0
1000
2000
3000
4000
5/8˝
(16 mm)
5/16˝
(6 mm) Tube
DUCT MEAN VELOCITY m/s
DUCT MEAN VELOCITY v ft/min
FLOWGRID DIFFERENTIAL PRESSURE
Δ
P IN Wg.
FlowGRID DIFFERENTIAL PRESSURE
Δ
p Pa
AFG iom1 1/3/06 2:00 PM Page 4