Jenway 6850 User Manual
Page 27
27
7.5.3
Spectral Points Analysis
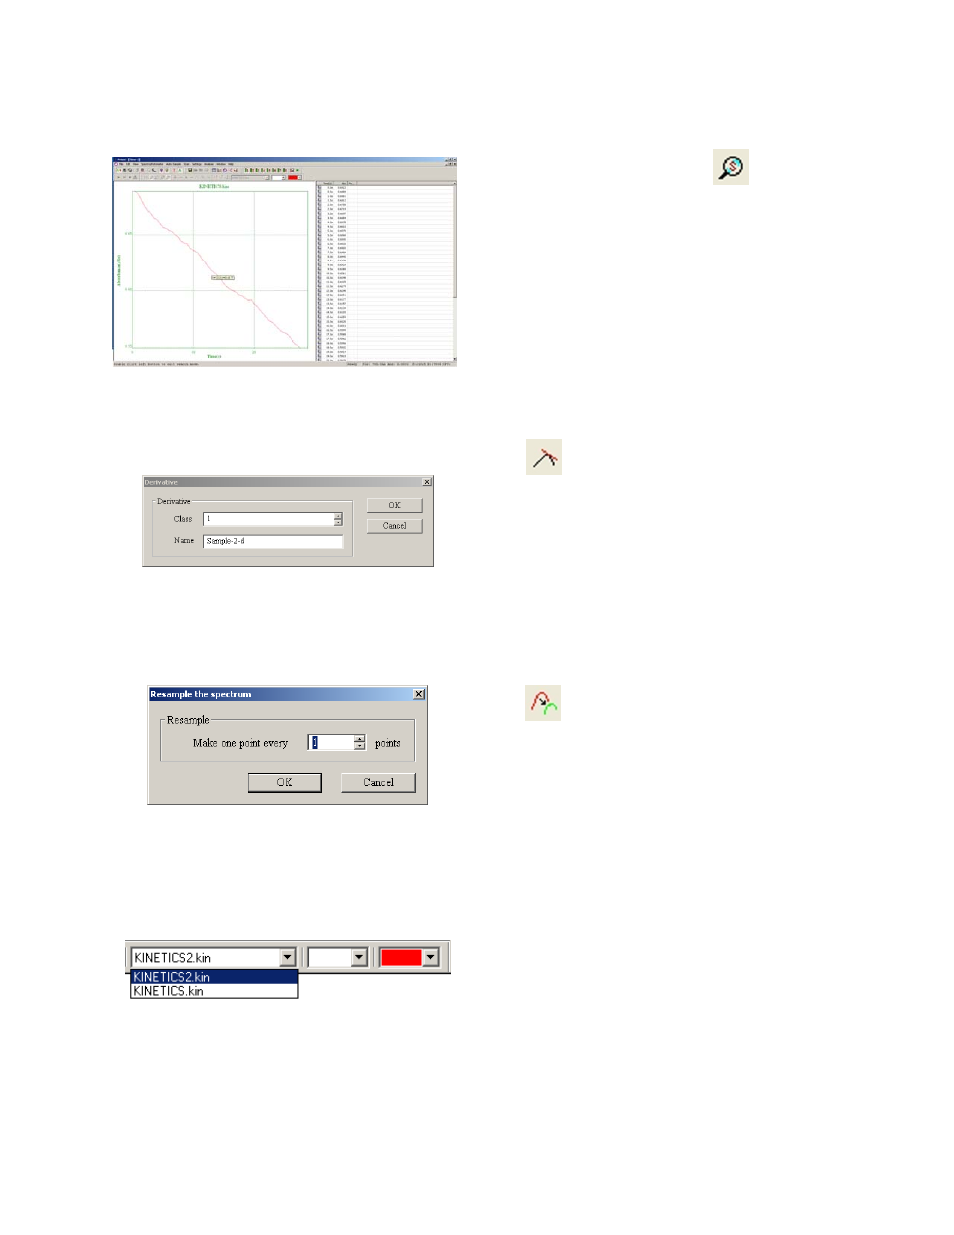
Select the Scan spectrum icon from the
toolbar. Move the cursor over the kinetics
spectrum to trace the scan and display the scan
data. Select the Scan spectrum icon again to exit
the spectral points analysis mode.
7.5.4 Kinetics
Derivative
Click
on the toolbar. A dialogue box
appears allowing the user to select the derivative
function required (1-10) and enter a name for the
calculated derivative spectrum. Select OK to
confirm. The derivative spectrum will be
displayed as an overlay on the original.
7.5.5 Remeasure
(Re-plot) Kinetics Scan
Click
on the toolbar. A dialogue box
appears asking the user to specify the frequency
of the data points in the re-plotted kinetics scan.
Select OK to confirm. The re-plotted kinetics
scan will be displayed.
7.6 OVERLAY
SCANS
The Prism Pc software can display multiple
kinetics scans simultaneously on the screen by
either measuring additional samples or loading
stored data. The active kinetics scan is selected
from the drop down menu on the toolbar. The
colours of the selected scan’s background and
photometric data can be selected using the
palette options on the toolbar.