Jenway 6850 User Manual
Page 22
22
6.5.3
Spectrum Zoom Function
Select the Zoom function icon
from the toolbar. Position the cursor in the upper-left corner of the
area you want to select. Hold the left mouse button to drag the cursor to outline the spectrum area you
want to enlarge. Release the mouse button. The part of the spectrum which is displayed within the
outlined area will be enlarged. Select the undo zoom icon
to restore the previous view settings.
Select the Zoom function icon again to exit the zoom function.
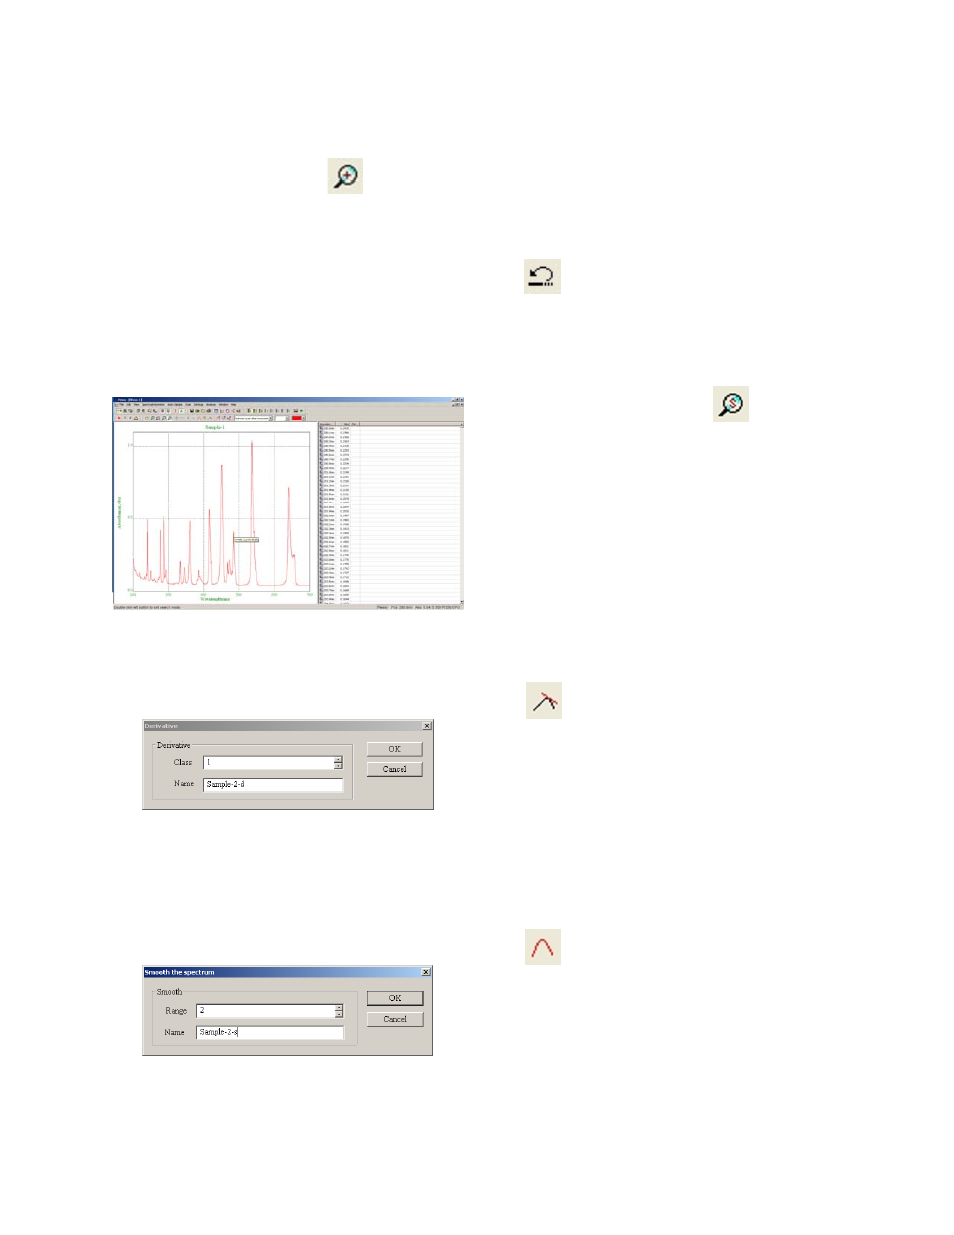
6.5.4
Spectral Points Analysis
Select the Scan spectrum icon from the
toolbar. Move the cursor over the spectrum
display to trace the scan and display the scan
data. Select the Scan spectrum icon again to exit
the spectral points analysis mode.
6.5.5 Spectrum
Derivative
Click
on the toolbar. A dialogue box
appears allowing the user to select the derivative
function required (1-10) and enter a name for the
calculated derivative spectrum. Select OK to
confirm. The derivative spectrum will be
displayed as an overlay on the original.
6.5.6 Spectrum
Smooting
Click
on the toolbar. A dialogue box
appears allowing the user to select the range of
the smoothing function (2-100) and enter a name
for the smoothed spectrum. Select OK to confirm.
The smoothed spectrum will be displayed as an
overlay on the original.