App1 app2 index connecting to the monitor server, Checking the communication status – Yokogawa DAQWORX User Manual
Page 18
2-3
IM WX83-01E
Monitoring with
AddObserver Panel
1
2
3
App1
App2
Index
Connecting to the Monitor Server
If you have already established a connection to the monitor server, the software
automatically accesses the connection when you open a panel.
Note
• To establish a connection ahead of time, follow the instructions in section 1.4, “Connecting
to the Monitor Server” before opening a panel.
• The measured data displayed in the panel is linked to the objects used when the panel was
created with the development tool. If the measured data transmitted to the monitor server
on the DAQ32 Plus, DAQEXPLORER, DAQLOGGER, MXLOGGER, GateCONTROL, or
GateEye changes, the measured data displayed in the panel also changes.
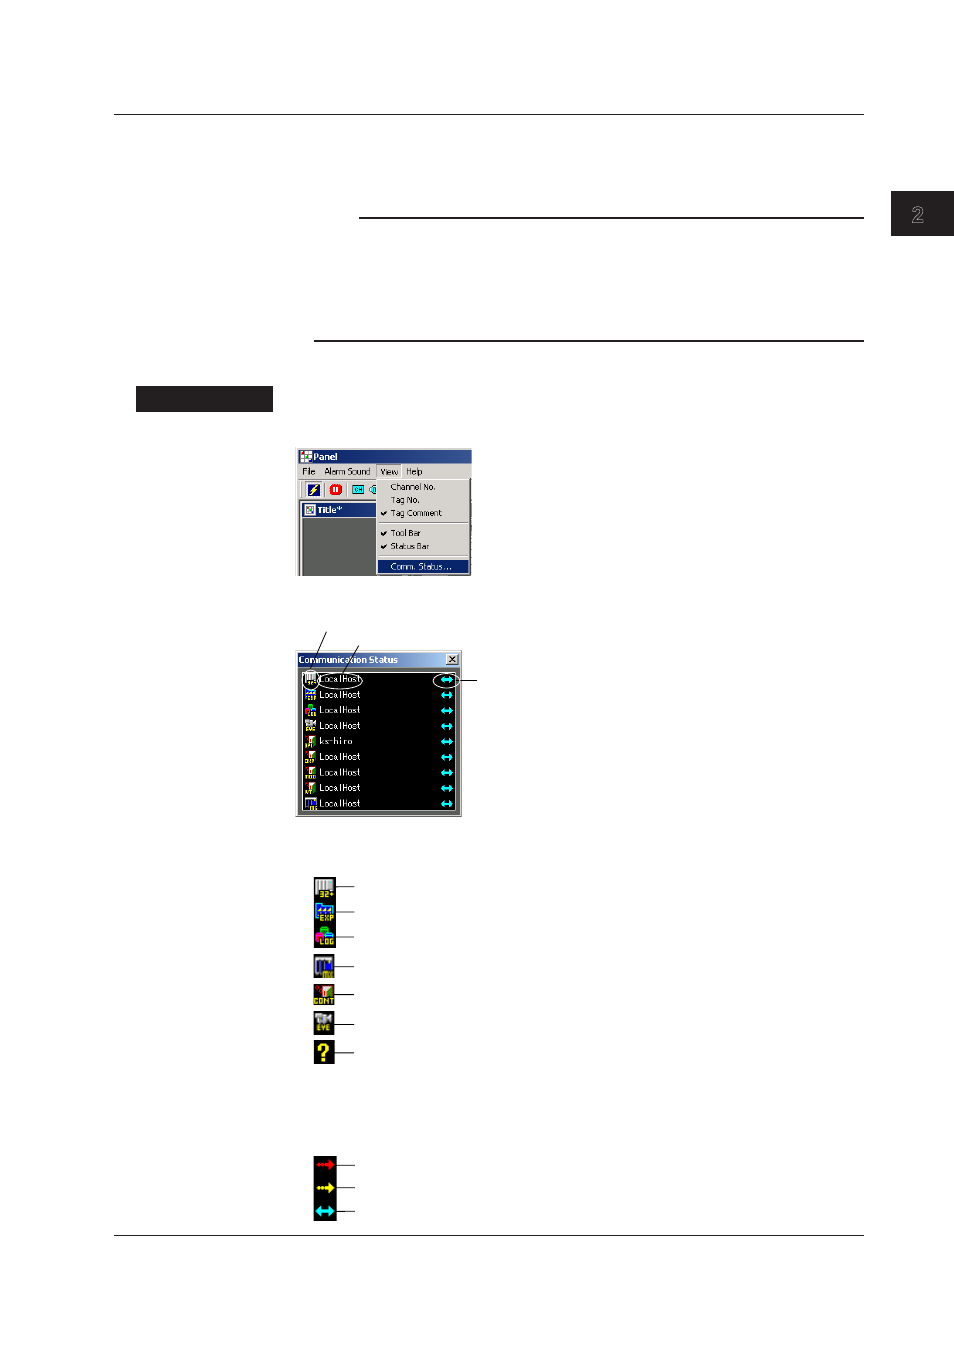
Checking the Communication Status
Procedure
Choose View > Comm. Status.
The Communication Status window is displayed.
Status
Host name
Server type
The contents of the Communication Status windows consist of the following three items.
• Server Type
DAQEXPLORER monitor server
DAQ32 Plus monitor server
DAQLOGGER monitor server
Failed or unrecognized connection
MXLOGGER monitor server
GateEye
GateCONTROL
• Host Name
The name of the connected host.
• Status
(Yellow) Connection not complete. Attempting to connect.
(Red) Connection failed.
(Blue) Connection successful.
2.2 Opening the Panel, Connecting to the Monitor Server, and Checking the Communication Status