Vanguard VCBA ver.10.xx User Manual
Page 40
REV 2 VCBA VERSION 10.xx SOFTWARE MANUAL
38
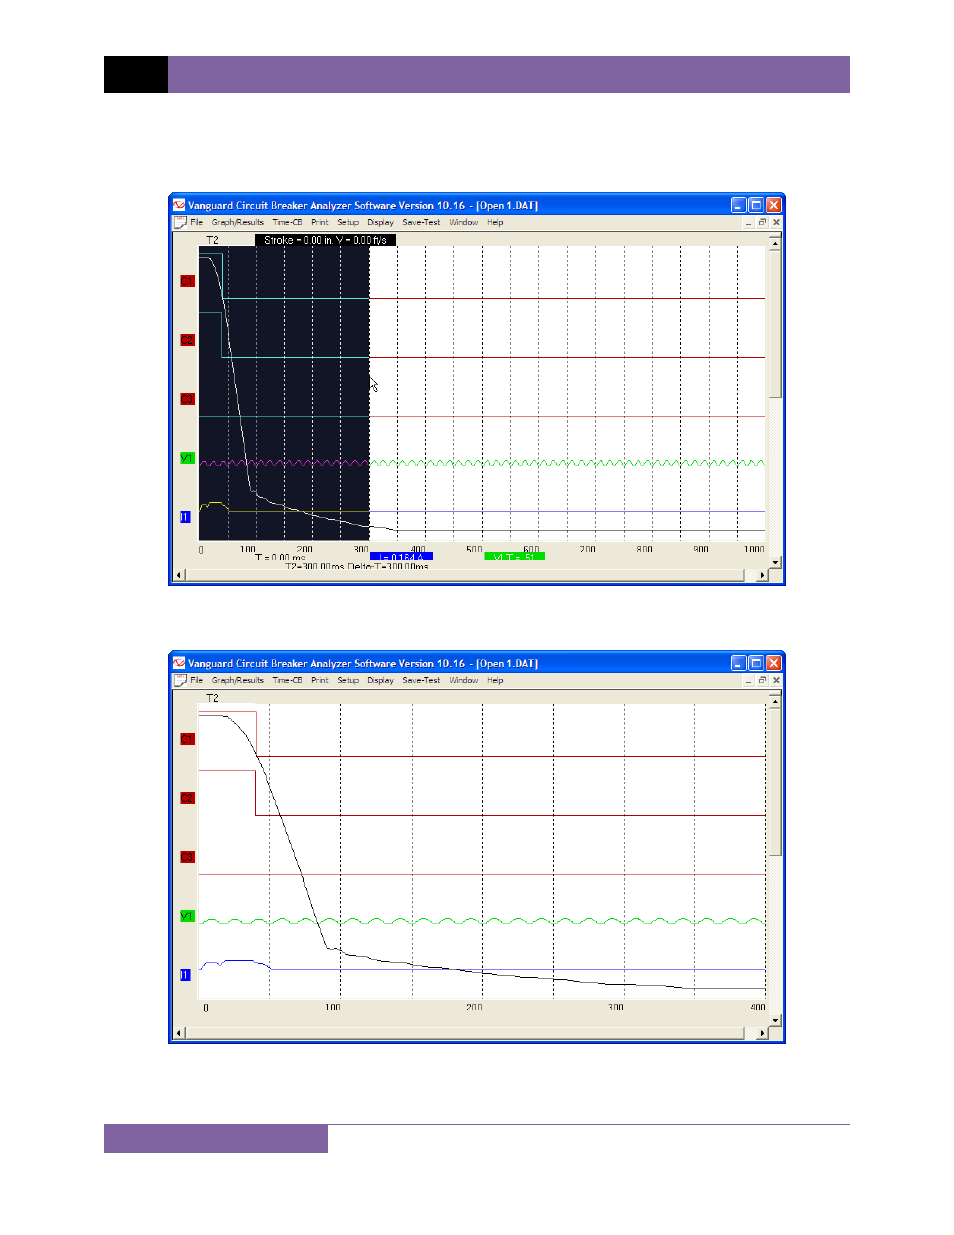
4. Hold down the left mouse button and drag the cursor to the right till the vertical hairline
is at 300ms and the text at the bottom of the graph reads “T=300.00 ms” as shown
below:
5. Release the mouse button and an expanded graph of the selected region will be
displayed as shown below:
6. You can further expand the expansion graph by using the steps above. The maximum
expansion that can be viewed is a range of 100ms.