Vanguard VCBA ver.10.xx User Manual
Page 32
REV 2 VCBA VERSION 10.xx SOFTWARE MANUAL
30
4.11 Viewing and Working with Graphic Test Results
To display graphic results of a timing record:
1. Retrieve the test record that you would like to view (See sections 4.2 and 4.3).
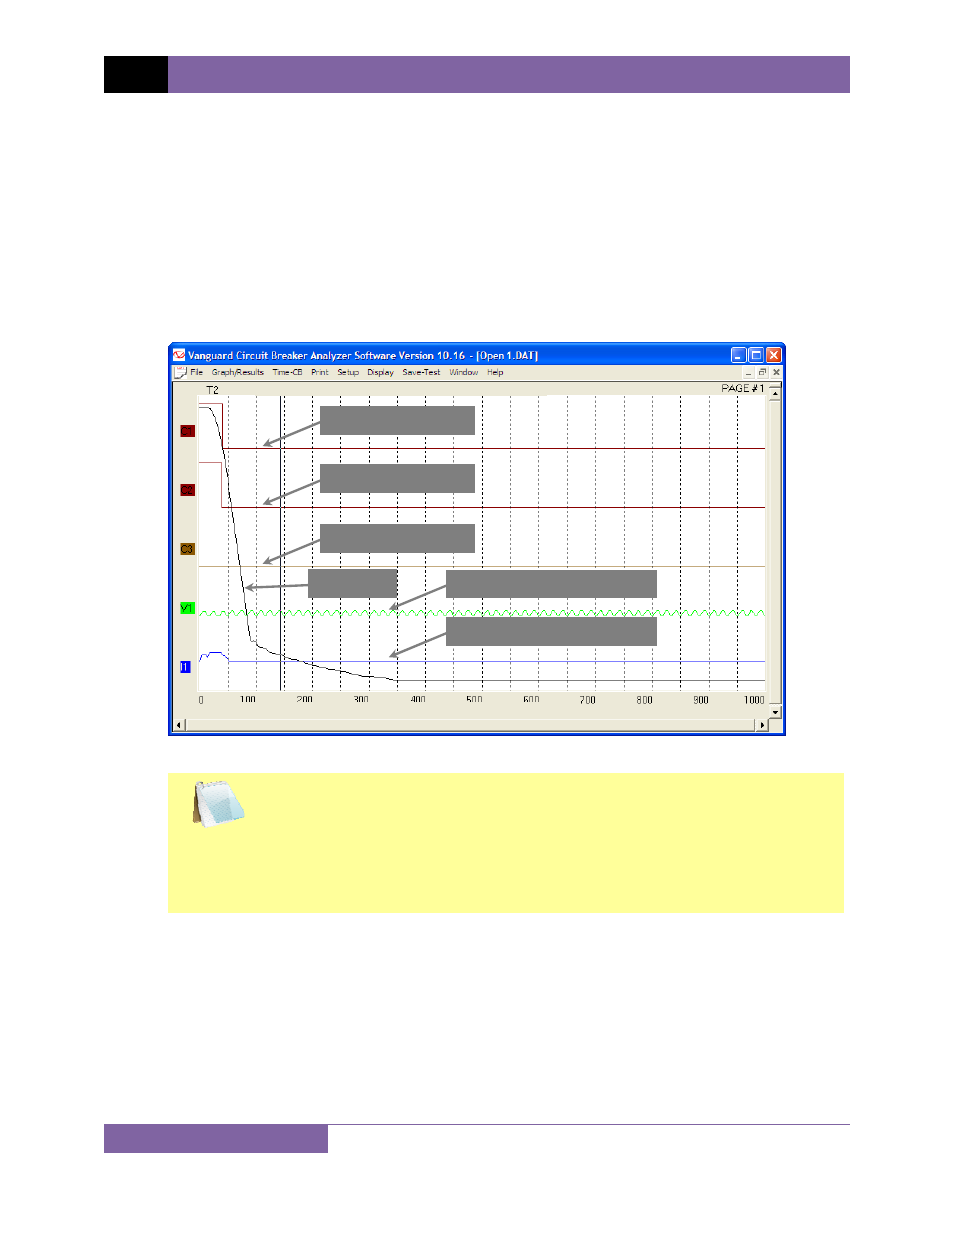
2. Click on the Graph/Results menu. The graphic results will be displayed as shown in
Figure 4. Click on the Graph/Results menu again to return to the tabulated test results
screen. Alternatively, you can press [CTRL]+[G] to toggle between the two views.
3. There are a total of 6 graphic results pages. Press the [Page Down] key to view the next
page. Press the [Page Up] key to view the previous page.
Figure 4 Graphic Test Results
NOTES
• Contact channel ID’s are shown as C1, C2, and C3 on the left side of
the graph. Up to 12 contact channels can be displayed on one graphic
report page.
• Voltage monitoring channel V1 is shown below contact channel C3.
• Coil initiate current is shown as I1.
Contact Channel 1 (C1)
Contact Channel 2 (C2)
Contact Channel 3 (C3)
Voltage Monitoring Channel 1 (V1)
Coil Initiate Current (I1)
Travel Curve