View menu selections – Teledyne LeCroy AORM - Advanced Optical Recording Measurements User Manual
Page 18
16
ISSUED:
June 2013
923133 Rev A
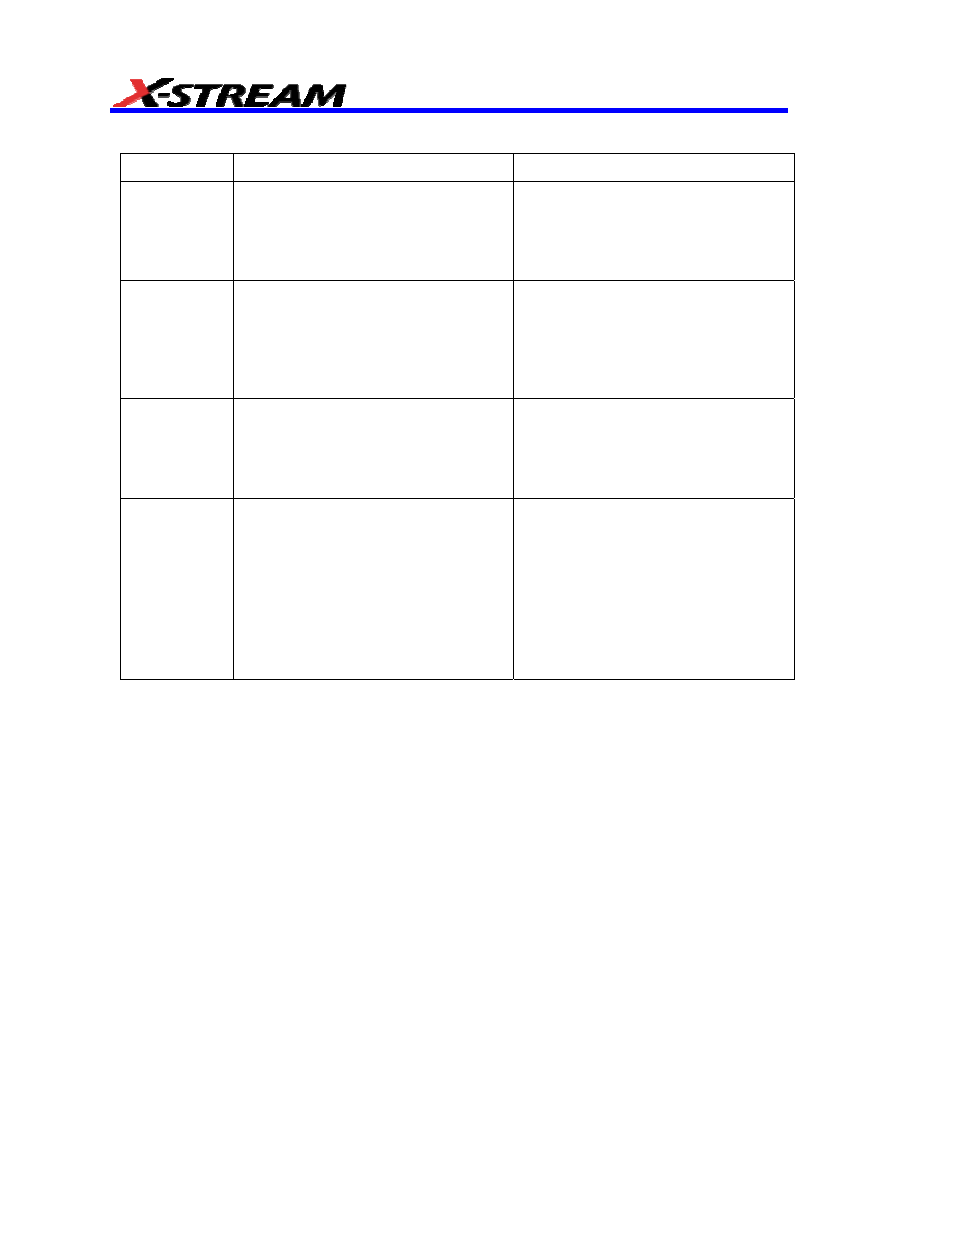
View Menu Selections
View
Displays
Additional
Keys
Parameter
The source traces will be displayed
along with the custom parameters
(see Measurement Table, next). If two
traces are to be displayed, dual grids
will be drawn.
Statistics
: toggles the parameter
statistics on/off.
Histogram
When Histogram is selected, a
histogram of the selected parameter
is displayed in a second grid, and a
new tab, “AORM Histogram,”
appears.
Find Center And Width
: determines
the best scaling for the histogram
based on up to the last 20,000
samples collected. This occurs
automatically if the Enable Auto Find
checkbox is checked.
Trend
When Trend is selected, a trend plot
of the selected parameter is displayed
in a second grid, and a new tab,
“AORM Trend,” appears.
Find Scale
: determines the best
scaling for the trend (center and
height). This occurs automatically if
the Auto Find Scale checkbox is
checked.
XY Plot
Plots the trend of the selected
measurement vs. either the trend
t@pit or pwid, as appropriate; not
available for all measurements (see
Measurement Table, next, for details).
When XY Plot is selected, a trend
plot of the selected parameter is
displayed in a second grid, and a new
tab, “AORM Trend Y,” appears.
Find Scale
: determines the best
scaling for trends (center and height).
This occurs automatically if the Auto
Find Scale checkbox is checked.