Zoom traces and segmented waveforms, Histogram peaks, Example – Teledyne LeCroy AORM - Advanced Optical Recording Measurements User Manual
Page 108
106
ISSUED:
June 2013
923133 Rev A
maxp
population of most populated bin in histogram
mode
data value of most populated bin in histogram
pctl
data value in histogram for which specified ‘x’% of population is smaller
pks
number of peaks in histogram
range
difference between highest and lowest data values
sigma
standard deviation of the data values in histogram
totp
total population in histogram
xapk
x-axis position of specified largest peak.
Zoom Traces and Segmented Waveforms
Histograms of zoom traces display all events for the displayed portion of a waveform between the
parameter cursors. When dealing with segmented waveforms, and when a single segment is
selected, the histogram will be recalculated for all events in the displayed portion of this segment
between the parameter cursors. But if All Segments is selected, the histogram for all segments
will be displayed.
Histogram Peaks
Because the shape of histogram distributions is particularly interesting, additional parameter
measurements are available for analyzing these distributions. They are generally centered
around one of several peak value bins, known (with its associated bins) as HistX@peak.
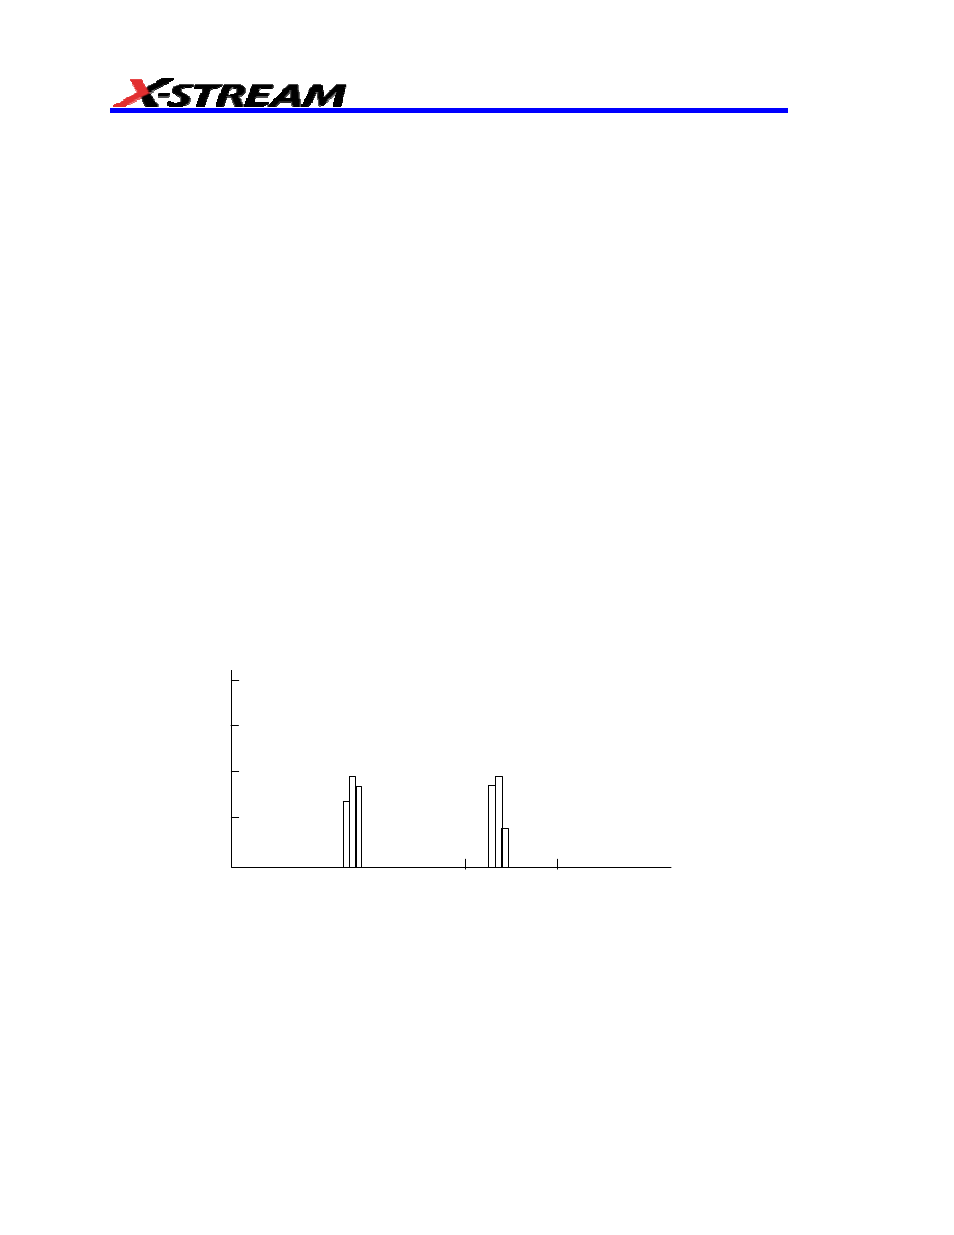
Example
In the next figure, a histogram of the voltage value of a five-volt amplitude square wave is
centered around two peak value bins: 0 V and 5 V. The adjacent bins signify variation due to
noise. The graph of the centered bins shows both as peaks.
0
5
Volts