Teledyne LeCroy PETracer PCI Express Edge User Manual User Manual
Page 169
PETracer Edge User Manual
Chapter 9: Reports and Tools
Teledyne LeCroy
161
Unit-Based Averaging
The Analyzer builds metric graphs using unit-based averaging (as opposed to
time-based averaging). For the total duration of a certain request (or Memory Write
transaction), the graph value is assumed equal to the corresponding metric for this
request (transaction). If there are overlapping operations for a certain time period, then
the value is calculated as an average of metric values for all the overlapped requests
(transactions).
It is important to remember that the Analyzer uses unit-based averaging rather than
time-based averaging. Time-based averaging can be misleading in some situations. For
example, consider the Throughput Per Transaction graph. Sometimes, while many
outstanding requests are in progress, latency (and response time) grows for each of the
transactions, resulting in a lower throughput per transaction over time (which is reflected
in the graph). This happens even though aggregated throughput across all the
transactions is constant.
Bus Utilization Window Features
For the seven Split- and Transaction-level graphs listed, all Bus Utilization window
features are available, such as zooming in/out, changing scale type, scrolling,
context-sensitive status, and graph synchronization. See Bus Utilization and Bus
Utilization Buttons for more on these features.
Note: Clicking a certain place within a graph area repositions the CATC Trace display at
the Link or Split transaction level to the transaction that was in progress at that time.
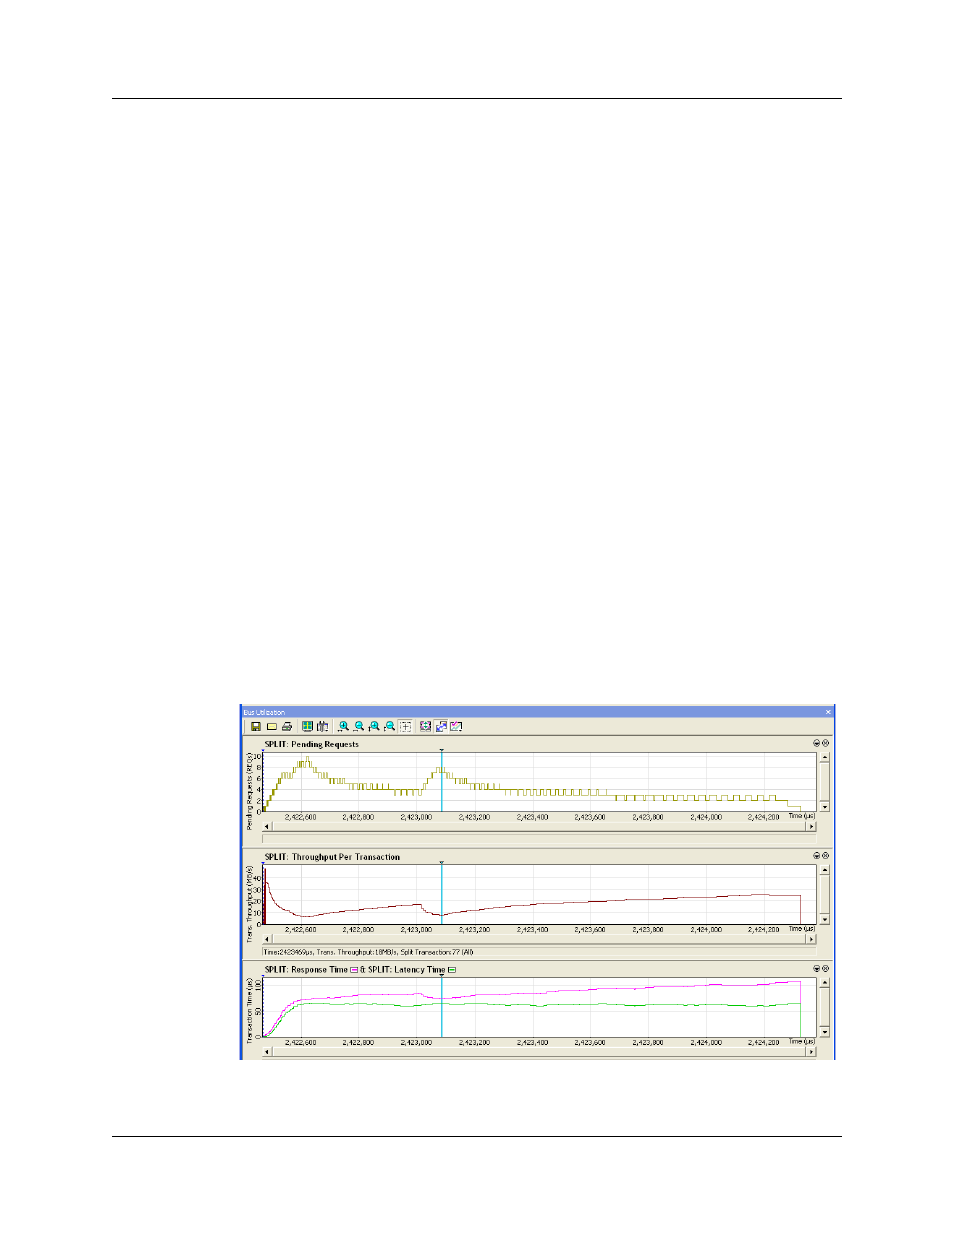
Split Transaction Level Graphs
Transactions at the Split level combine all the non-posted requests with corresponding
completions. This includes Configuration and IO Read and Write requests, as well as
Memory Read requests.
The following shows the graphs for the Split level: