Show metrics in the traffic summary window – Teledyne LeCroy PETracer PCI Express Edge User Manual User Manual
Page 166
Chapter 9: Reports and Tools
PETracer Edge User Manual
158
Teledyne LeCroy
Show Metrics in the Traffic Summary Window
Some of the Traffic Summary reports at the Link and Split Transaction levels are based
on metrics collected for the corresponding protocol units in the CATC Trace.
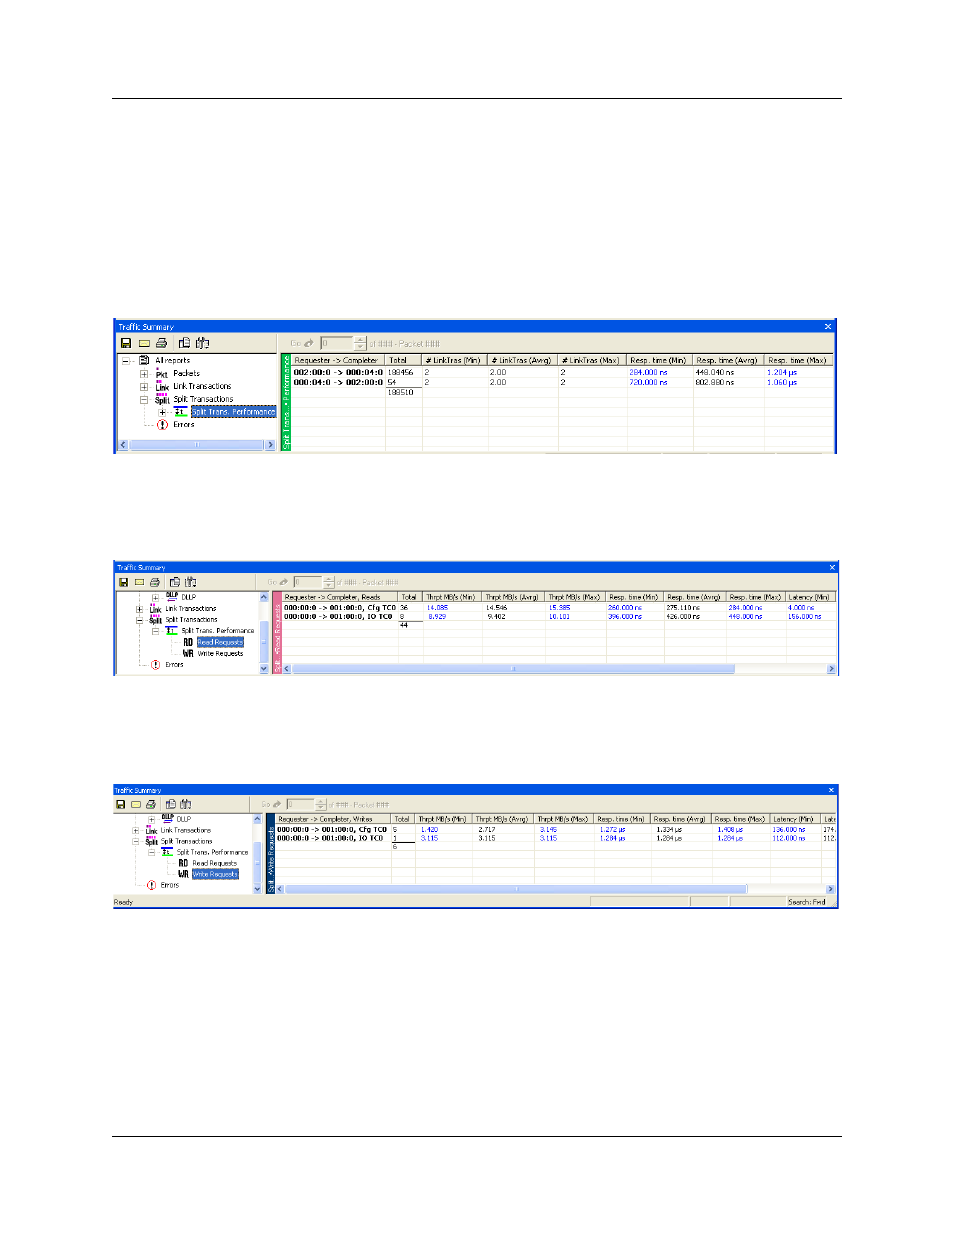
Reports at Split Transaction Level
Split Transaction Performance: This report table groups the Split Transactions by
Requester-Completer pair and displays Minimum/Average/Maximum data for Number Of
Link Transactions and Response Time metrics.
Read Requests Performance: This report table includes only the Split Transactions that
present Read Requests (Configuration, IO and Memory). It groups them by the
combination of Requester-Completer pair, request type, and Traffic Class and displays
Minimum/Average/Maximum data for Throughput, Response Time, and Latency metrics.
Write Requests Performance: This report table includes only the Split Transactions that
present Write Requests (Configuration and IO). It groups them by the combination of
Requester-Completer pair, request type, and Traffic Class and displays
Minimum/Average/Maximum data for Throughput, Response Time, and Latency metrics.