General Tools and Instruments HT10 User Manual
Page 15
15
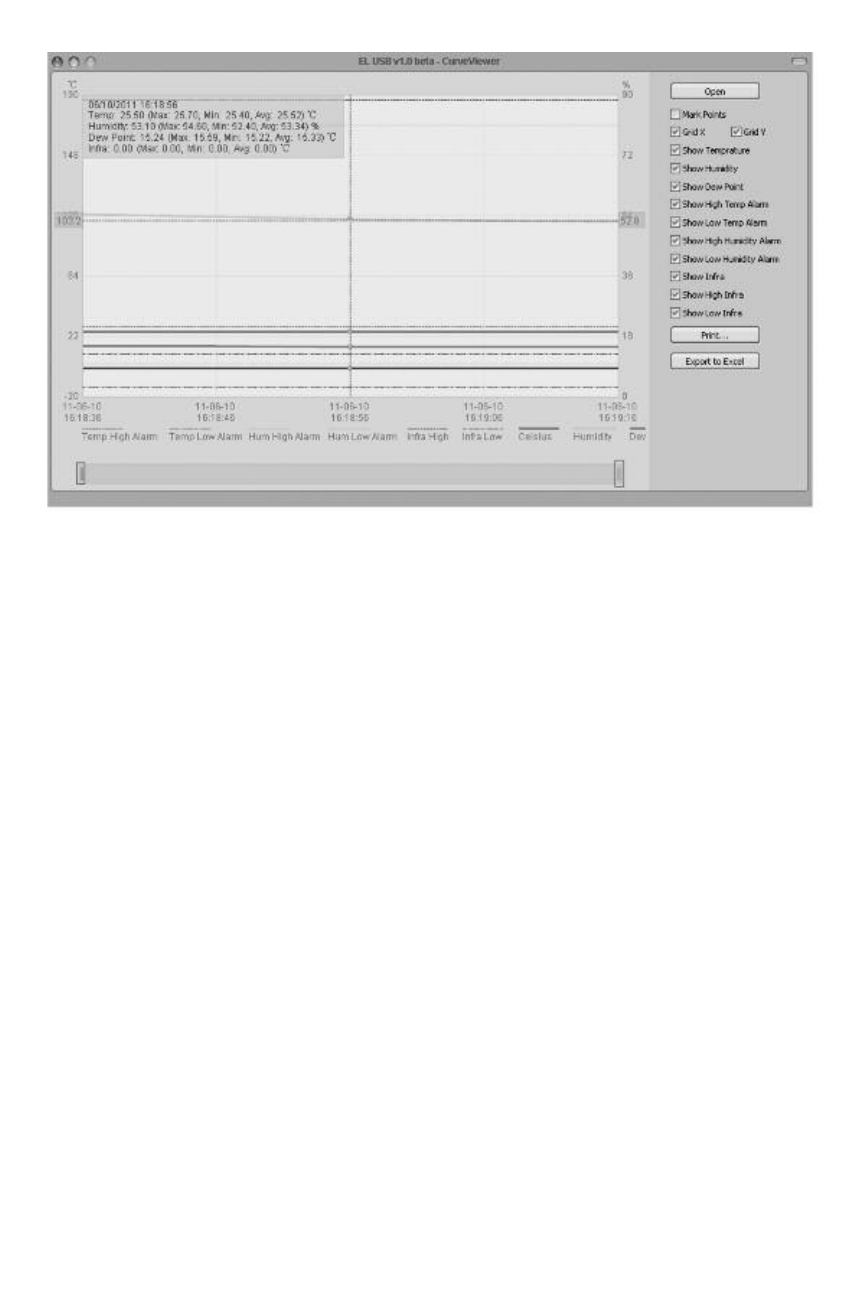
Fig. 4. A typical initial plot of an imported data log
There are several features shown in Fig. 4 worth noting:
• To mark the position of every recorded data point on the
curve, check the “Mark Points” box at the top of the sidebar
at right.
• To get a higher-resolution view of the data recorded during
a specific period of time, scale up and down the curves by
dragging the slider at the bottom of the window left and
right.
• Hovering the cursor over a particular point of the curve
displays all data related to this point—including the
maximum, minimum and average values of the entire
curve—in a shaded box at upper left.
• The dates and times shown on the x-axis scale and in the
upper left corner are in sync with your computer’s clock.
• To print the .txt file of any data log, click the Print virtual
button.
- 119 (1 page)
- 146 (2 pages)
- 1478 (1 page)
- 147 (1 page)
- 80560 (1 page)
- 840 Pro Doweling Kit (36 pages)
- 840 use of Dowel Centers (4 pages)
- 841 (8 pages)
- 849 (2 pages)
- 850 (2 pages)
- 860 v.1 (16 pages)
- 860 v.2 (44 pages)
- 860 Addendum (1 page)
- 870 v.1 (2 pages)
- 870 v.2 (46 pages)
- 880 (2 pages)
- 861 (16 pages)
- AQ150 (16 pages)
- AT60LR (1 page)
- BAR4225 (13 pages)
- BF10 (12 pages)
- CA10 (16 pages)
- CAF4221 (12 pages)
- CAF4224 (14 pages)
- CDM77232 (15 pages)
- CDM77535 (12 pages)
- CGD900 (12 pages)
- CIH20DL (28 pages)
- CL10 (20 pages)
- CMM880 (11 pages)
- CMR35 (36 pages)
- CPH12101 (1 page)
- CT101 (8 pages)
- CT102 (8 pages)
- CT103 (8 pages)
- CT6235B (16 pages)
- DA833 (16 pages)
- DAF2005MDL (27 pages)
- DAF3300 (40 pages)
- DAF3010B (12 pages)
- DAF4207SD (16 pages)
- DAF4223 (13 pages)
- DAF80PWM (10 pages)
- DAF80PW (10 pages)
- DBAR110 (16 pages)