P.29, 7 typical performance diagrams – Camco D-Power 7 User Manual
Page 30
D - P O W E R
S E R I E S
Vrms
dB
-100
-20
-90
-80
-70
-60
-50
-40
-30
100u
6
200u
500u 1m 2m
5m 10m 20m
50m 100m 200m 500m 1
2
T�
Vrms
dB
-120
-20
-110
-100
-90
-80
-70
-60
-50
-40
-30
100u
6
200u
500u 1m
2m
5m 10m 20m
50m 100m 200m 500m 1
2
2
4
8
0
1000
2000
3000
4000
5000
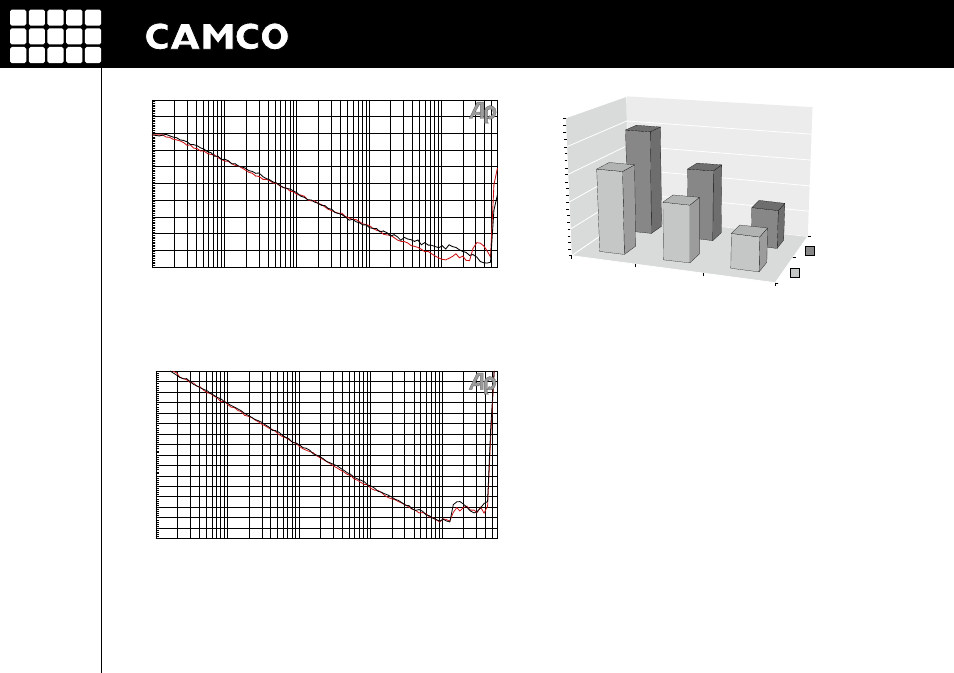
Distortion limited
output power (0,1 % THD)
Peak power
Impedance / Ω
W
atts
3090
4023
2715
2113
1257
1458
USER MANUAL
D-POWER 7
P.29
Figure 7.9
CCIF difference frequency method (10,5 kHz and 11,5 kHz) vs. input level
@ 4 Ω (Ch1,
Ch2
) (Measurements of a typical performance)
Figure 7.12
D-POWER 7
(Measurements of a typical performance)
Figure 7.10
SMPTE intermodulation distortion (60 Hz and 7 kHz) @ 4 Ω vs. input level
(Ch1,
Ch2
) (Measurements of a typical performance)
7 TYPICAL PERFORMANCE DIAGRAMS