P.27, 7 typical performance diagrams – Camco D-Power 7 User Manual
Page 28
D - P O W E R
S E R I E S
Hz
Hz
-180
+180
-135
-90
-45
+0
+45
+90
+135
Hz
-110
-10
-100
-90
-80
-70
-60
-50
-40
-30
-20
20
20k
50
100
200
500
1k
2k
5k
10k
Hz
20 50 100 200 500 1k 2k
5k 10k
20k
USER MANUAL
D-POWER 7
P.27
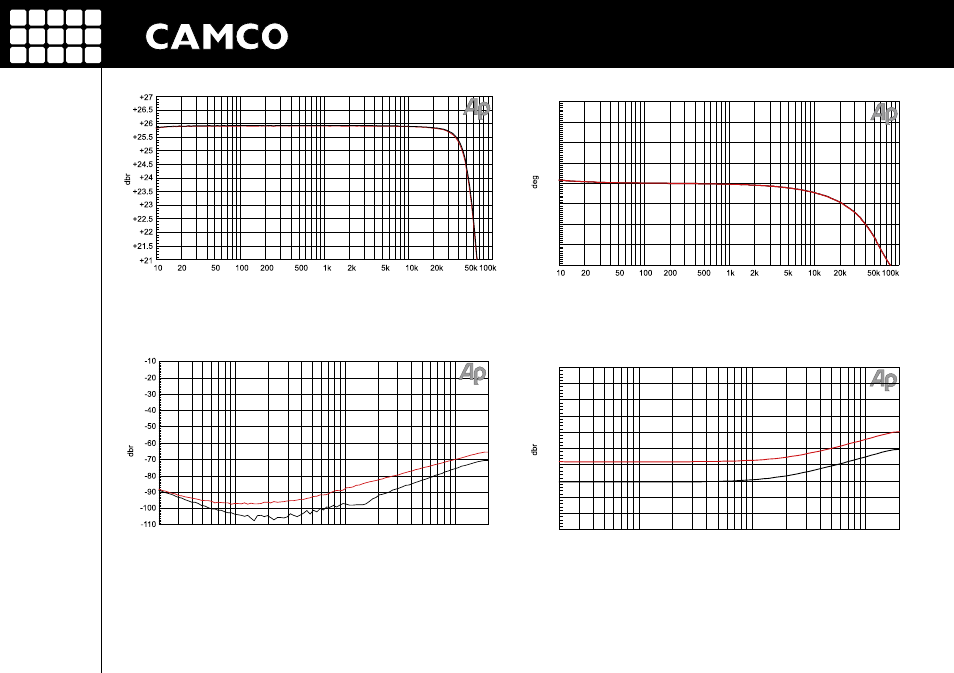
Figure 7.1
Gain vs. frequency (Ch1,
Ch2
)
(Measurements of a typical performance)
Figure 7.3
Phase vs. frequency (Ch1,
Ch2
)
(Measurements of a typical performance)
Figure 7.2
Channel separation vs. frequency @ 10 W / 4 Ω (Ch2 => Ch1,
Ch1 => Ch2
) (Measurements of a typical performance)
Figure 7.4
Common mode rejection ratio (Ch1,
Ch2
)
(Measurements of a typical performance)
7 TYPICAL PERFORMANCE DIAGRAMS