Advanced analysis and math functions – Atec Yokogawa-DL9000 Series User Manual
Page 4
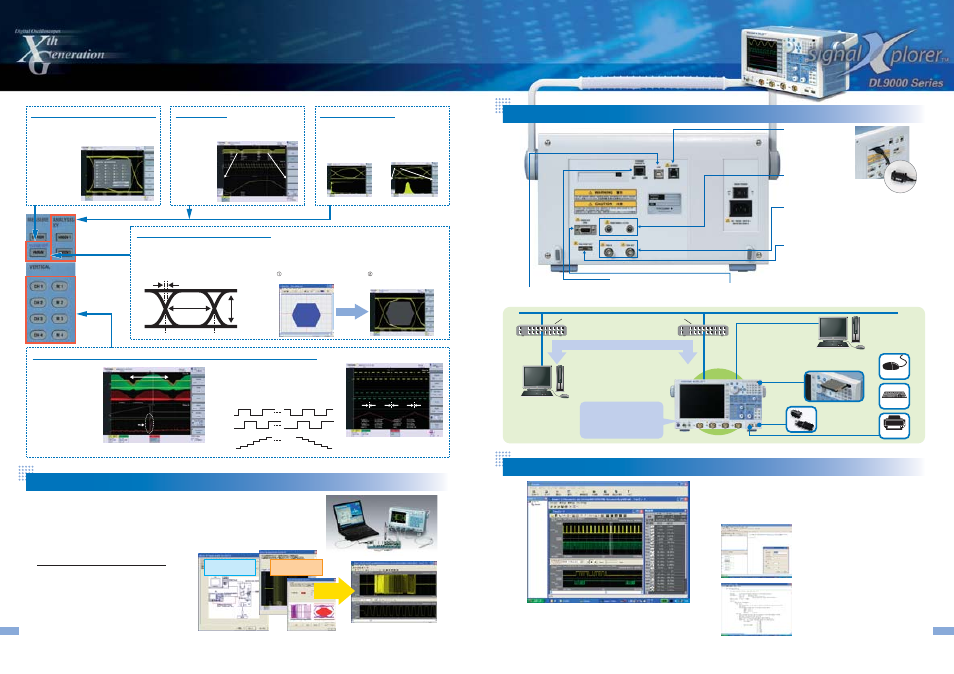
6
Can be used to output the
results of either GO/NO-GO
tests or mask tests for
communication purposes
as a TTL level signal.
GO/NO-GO I/O
(Factory-set option)
Probe power
Separate ports available
for external trigger input
and output.
Trigger I/O
Can be used to control the DL9000 externally
or to upload data from the DL9000 to a PC.
USB-PC connection port
(Factory-set option)
100BaseTX/10BaseT Ethernet
Can be connected to an
external monitor
Video OUT
Trigger types not supported by the DL9000 can be
realized with external circuits that utilize the trigger
comparator outputs of respective channels.
Trigger comparator OUT
A PC card slot is standard.
A National Instruments’
PCMCIA-GPIB card is
required to be able to
use the GPIB interface.
GPIB interface
7
Advanced Analysis and Math Functions
DL9240 or DL9240L digital oscilloscope
(with Ethernet option)
• PBD2000 differential probe (one or two)
• PBA2000 active probe (two or three)
• 701933 current probe (one)
• Test bed PC (English Windows XP)
• 3 1/2-digit or greater DMM
• Pulse generator
• 701985 USB test fixture and software (one)
Example of System Configuration
100BASE-TX-compliant converter (hub or router)
Detailed waveform analysis is possible with
the Xviewer Waveform Analysis Software
Test Software
For more information, see Bulletin 7019-85E, “USB 2.0-compliant Test Solutions.”
Transfer of waveform
data/frame data/setup data
Remote-control
USB
(Standard on
rear panel)
Ethernet
(/C10 and /C8 options)
Jitter
Eye Width
Phase A
Phase A leads
Phase B leads
Eye
Height
Xviewer runs on a PC and can be used to view waveforms captured with the DL9000
and to convert binary waveform data to ASCII data. Adding the Math option to Xviewer
enables you to freely define computational expressions and to perform waveform math.
This software supports FFT calculations with a maximum record length of 2 M words.
Xviewer
(optional software)
This API lets you control the DL9000 series from an
external program or to transfer the DL9000 series’ data
to the external program. The API is available as a DLL
and can be accessed from your program.
DL Series Library
(freeware)
With the MATLAB tool kit, you can easily deal with
waveform data captured using the DL series
oscilloscope in a MATLAB environment. The software
can be used to control the DL series’ panel settings or
to transfer data from the DL series to MATLAB.
MATLAB Control Tool Kit
(Optional software)
Additional details about Yokogawa’s software tools and information for downloading
free software and trial versions of nonfree software can be found at:
http://www.yokogawa.com/tm/tm-softdownload.htm
Supports USB
storage/memory
Mouse
Keyboard
Printer
Transfer of waveform data/
frame data/setup data
Remote-control of network drives
E-mail transmission (GO/NOGO action)
DL9000’s Storage Media
• 40-GB built-in hard disk
(/C8 option)
• 90-MB flash ROM (standard)
Flexible System Configuration
A DL9240 or DL9240L together with the USB test fixture, test software and probes, allow you to test a USB device, host or hub for
compliance to USB-IF specifications.
User-friendly Operability based on PC Software
The test software shows connection methods and test procedures in a wizard form for each tests item. It shows connections, settings
and operations necessary for carrying out each test enabling even first-time users to perform test easily.
Collaboration with Xviewer
You can output waveform data from a test result window to analyze failed signals using the Xviewer waveform analysis software.
Automatic Waveform Parameter Measurements
The figure on the right shows the
voltage and current waveforms of a
switching power supply.
The red math trace M1 has been
calculated under the following
conditions:
M1 = Ch. 1 (voltage)
ϫ Ch. 2 (current)
Ch. 1: Differential voltage probe (yellow)
Ch. 2: Current probe (green)
You can calculate and display up to 8
math traces. The functions to choose
from include: Filtering, +, -, x,
Integration, Edge Count and Rotary
Count. Since basic arithmetic
operations are performed using
hardware, the DL9000 can display
results in real time.
Math Functions (Addition, Subtraction, Integration, Edge Count, and Rotary Count)
v Eye Pattern Analysis
This function automatically measures the waveform
parameters of an eye pattern. Unlike the waveform
parameter measurement of earlier DL series
oscilloscopes, the DL9000 can calculate
parameters based on the eye pattern formed by the
crossings of two or more waveforms.
v Real-time Math Traces (Rotary Count)
This function counts and displays the number of edges
between 2 input signals (Phases A and B).
E.g, if Phase B leads (negative phase sequence), this
function counts down. This function can be used to check
the rotational angle of a motor.
v Mask Testing
This function is used to evaluate the signal quality of high-speed data
communication. Using Mask Editor software, a mask pattern is generated and
loaded into the DL9000.
(The Mask Editor software can be downloaded from Yokogawa Electric’s web page.)
Mask pattern generation using
the Mask Editor software
After loading the mask pattern to
the DL9000, you can perform error
rate analysis or go/no-go judgment.
Eye Pattern Analysis and Mask Testing
Trend Displays
Histograms show waveform behavior, over an extended
period time, relative to time (jitter) and voltage (noise).
According to an on-screen histogram, you can analyze
statistics, including max., min., average, and standard
deviation. You can also display waveform parameter
histograms, such as voltage P-P, frequency etc., to see
how parameters vary over time.
Histogram Displays
Voltage histogram showing noise
Pulse Width Trends
of a switching power
supply.
Example of a Switching Power Supply’s Waveform
Obtained by the Multiplication “Voltage
ϫ Current”
Calculation of Phase A and Phase B
(Ch. 1 and Ch. 2) Parameters and
“Rotary Count” Math Traces
Time histogram showing jitter
You can automatically measure waveform parameters,
including max., min., peak-peak, pulse width, period,
frequency, rise time, fall time, and duty ratio. You can also
calculate the statistics of waveform parameters, such as
the average, max.,
min., and standard
deviation, over
multiple cycles within
an acquisition or
over multiple
acquisitions.
The DL9000 graphs the long-term trends of data items
obtained by automatic waveform parameter measurements.
With the Trend display, you can observe short-term cyclic
waveform
fluctuations within
a single frame, or
medium to long-
term waveform
fluctuations by
plotting frame-by-
frame periods.
Phase B
Rotary Count
math trace
Shows connection
methods and test
procedures
Shows test results
and generates
test reports
De
Device loss
IntegTY (M1)
IntegTY (M1)
Calculates statistics f
Calculates statistics for this period
Vds
Id
M1
USB Compliance Test Solution
Versatile Connectivity
Software Tools
Supports flash ATA
cards/hard drives
CW
CCW
CW
CCW