Atec Gigatronics-8650A Series User Manual
Page 9
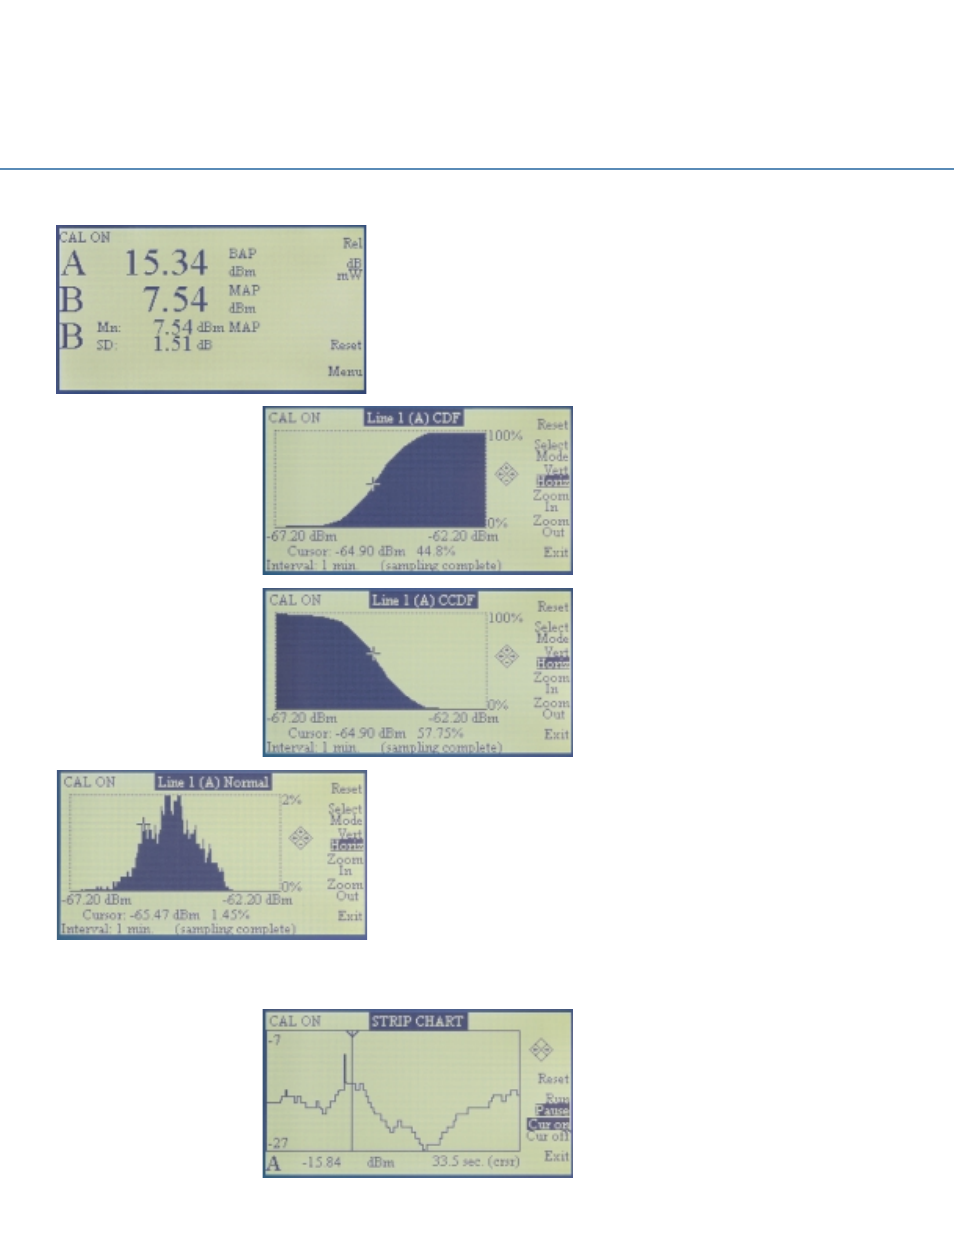
View the mean power and standard
deviation of the modulated signal
over a time period of interest.
Standard deviation offers an alter-
native descriptive analysis of the
power variation when compared to
the traditional crest factor.
STATISTICAL
ANALYSIS
Excessive cost can prove as
detrimental to the success of
communications equipment
as inadequate performance.
The 8650A provides a
range of statistical power
measurement analysis fea-
tures that help you optimize
your designs to prevent inad-
equate performance due to
under design or excessive
cost due to over design.
These features include
crest factor, standard devi-
ation, strip chart, CDF/CCDF,
and histogram, and they let
you view and thoroughly
analyze the power signal
over a selected period of
time.
Combined, they make the
8650A the most advanced
power meter available for
communications systems
design.
The histogram function allows you
to view a power range distribution
over a period of time. The x axis
displays the minimum to maximum
power levels measured during the
interval time period, and the y axis
displays the percent of time each
power level is measured. A zoom
feature lets you view smaller seg-
ments of the power range to bet-
ter analyze the percentage of time
a specific power level has occurred.
The strip chart function allows you to view the vary-
ing power levels of a signal over a
period of time. The x axis displays
time from the start of the meas-
urement to a selectable period of
1 to 200 minutes, and the y axis
displays the minimum to maximum
power levels measured during the
selected period. Moving a cursor
along the x axis displays time and
the corresponding power level.
The Cumulative Distribution
Function (CDF) shows the
percentage of time a signal is
below a selected power level. The
x axis displays the amount of
power at the selected level, meas-
ured in dBm, and the y axis dis-
plays the percentage of time the
power is at or below the power
specified by the x axis. The
Complementary Cumulative
Distribution Function (CCDF) reori-
ents the CDF curve in accordance
with the equation CCDF = 1-CDF
for more accustomed viewing of a
descending slope. Moving a cursor
along the slope of the curve dis-
plays the power level in dBm and
the corresponding percentage of
time the signal is above that level.