Electric and magnetic field measurement, Harmonic analysis mode, Remote and data analysis software efa-ts – Atec Narda-EFA300 User Manual
Page 3
31
narda
Safety Test Solutions an
communications company USA • Germany • Italy
USA TEL: (1) 631 231-1700 • FAX: (1) 631 231-1711 • E-MAIL: [email protected] • www.narda-sts.us
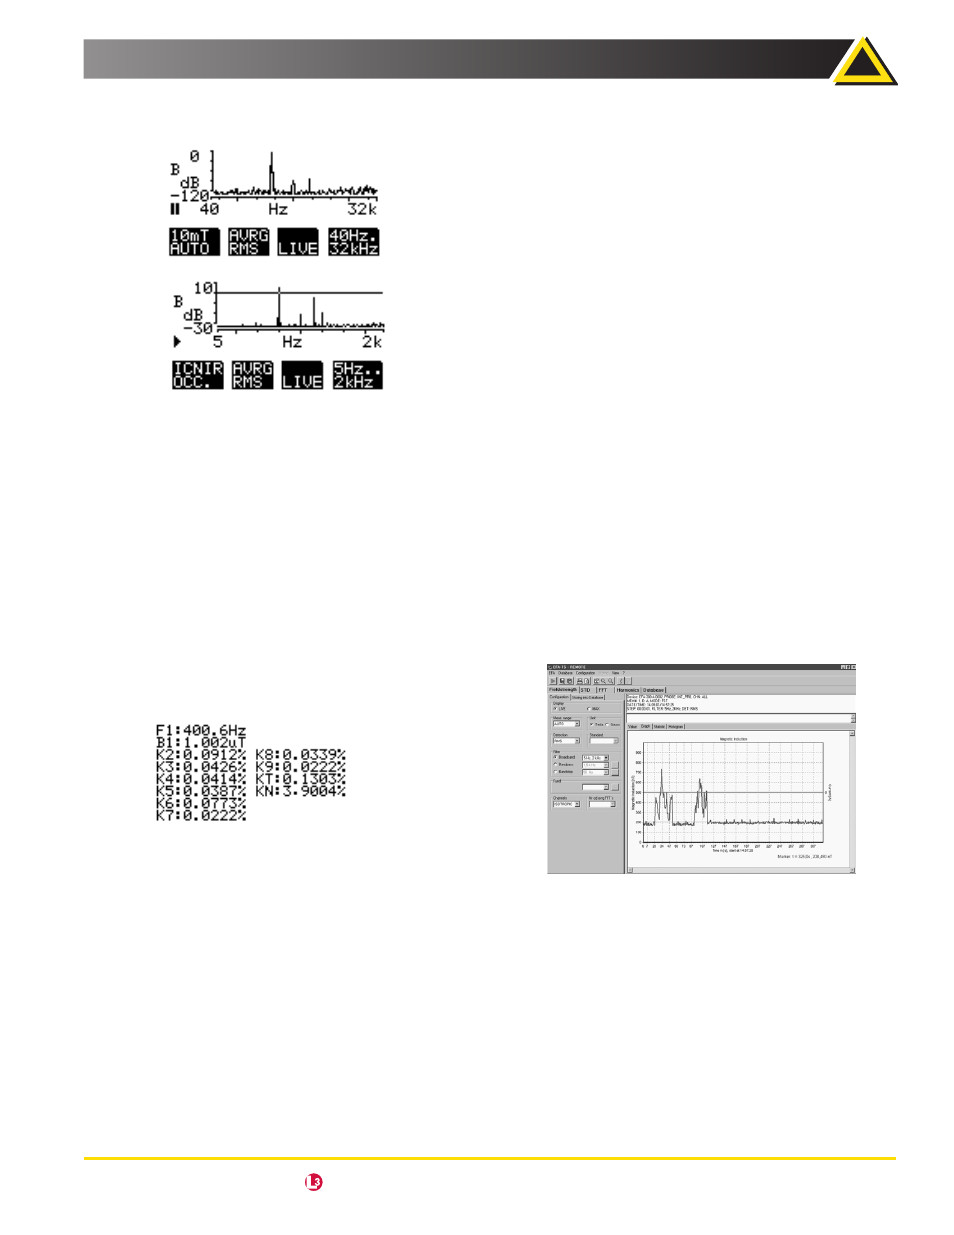
Electric and Magnetic Field Measurement
The EFA-300 is so powerful that even transient events ranging
up to 2 kHz can be analyzed in real time.
Evaluation is supported by graphics to clearly show the fre-
quency spectrum and by cursor functions with frequency
and level indications. The RMS and peak values of the nine
most significant frequency components are easy to read.
You can also use this mode to normalize the display to a given
standard. The measured value is then displayed relative to its
associated standard. In visual terms, the frequency-depen-
dent standard becomes a straight line. This makes it easy to
determine the relevancy of each spectral component.
Harmonic Analysis Mode
(Included with Spectrum FFT Mode)
This mode enables fast, convenient evaluation of the harmon-
ic spectrum. A table lists the field strengths of the measured
fundamental frequency along with up to 8 harmonics.
This feature is very useful for a “hands-off” verification of pow-
er quality (“Quality of Service”) in addition to occupational
safety applications.
Remote And Data Analysis
Software EFA-TS
This optional software is used to:
Provide remote control of the field analyzer
•
and data readout
Download the data stored in the device
•
Save acquired data on the computer
•
Analyze the data and provide a graphic representation of
•
the results to support the user in the preparation of mea-
surement reports
featureS
Windows® interface to configure the instrument and/or to
•
control it remotely.
Graphic representation of data stored in the internal mem-
•
ory of the instrument or in a file:
Line diagrams show field strength or Percent of
−
Standard versus time. Can be used in real time.
Display of spectrum
−
Bar graph of harmonics
−
2D-views with import possibility: background maps
−
for Matrix-data sets
Graphic tools – zoom, marker, set-up for scale, color/
−
thickness of lines, etc.
Additional Analysis Functions:
•
Statistics – mean and maximum values, histogram,
−
and number of values over a defined threshold
Peak list for spectrums
−
Export Functions
•
Data sets as ASCII-files
−
Graphic screen into the clipboard
−
minimum SyStem requirementS
Microsoft® Windows® 95 or Higher
−
Windows NT® 4.0 or Higher
−
Pentium Processor
−
Min. 4 MB RAM
−
Graphic card VGA 640/480, 256 colors
−
CD-ROM
−
efa-300 field analyzer