Atec Agilent-8566B User Manual
Page 11
Log Digitization Uncertainty
10
0.2
2 dB/div
1 dB/div
f O . l
0.04
0.02
Linear Digitization Uncertainty
Error Correction Accuracy (applicable when SHIFT W
and SHIFT X are executed)
0.4
Reference Line Accuracy Equals the sum of reference
level accuracy plus the scale fidelity between the
reference level and the reference line level.
Dynamic Range
Spurious Responses (signals generated by the
analyzer due to input signals) for signals
at the input mixer, all harmonic and intermodulation
distortion 70
below input signal.
Second Harmonic Distortion
(for mixer levels -40
100
Hz to 50 MHz
-70
50 to 700 MHz
-80
700 MHz to 2.5
-70
For mixer levels -10
2 to 22
-100
- 6 0
- 3 0
- 2 0
- 1 0
0
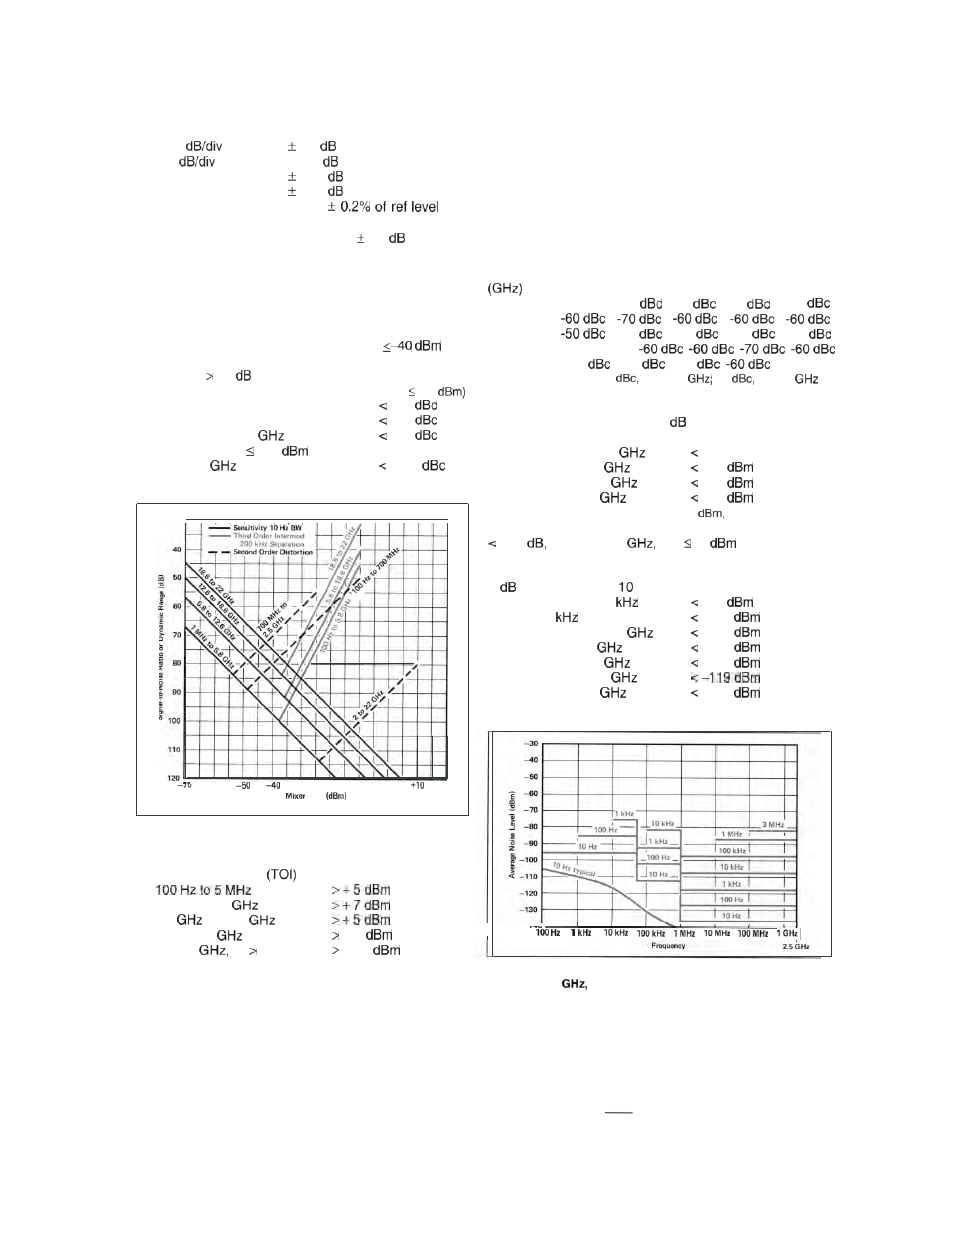
Level
Fig. 4. Typical optimum dynamic range
Third Order Intermodulation Distortion
Third Order Intercept
5 MHz to 5.8
5.8
to 18.6
18.6 to 22
+ 5
(typical)
2 to 22
for 100 MHz
+ 50
(typical)
signal separation
Image, Multiple, and Out-of-Band Responses
Image responses are due to input signals that are two
times the IF frequency above or below the tuned
frequency. Multiple responses are due to input signals
mixing with more than one LO harmonic. Out-of-band
responses are due to input signals outside of the
selected frequency band.
Applied
Tuned
Frequency Frequency
O-2.5
2.0-5.8 5.8-12.5 12.5-18.6 18.6-22.0
O-2.5
N A
-60
-60
-60
-60
2.0-5.8
5.8-l 2.5
-60
-70
-60
-60
12.5-18.6
- 4 5 d B c
18.6-22.0
-40
-60
-60
-70 dBc*
*Image Responses:
-60
18.6-20.0
-50
20.0-22
Residual Responses (signals displayed by the analyzer
independent of input signals), 0
input attenuation, no
input signal.
100 Hz to 5.8
-100 dBm*
5.8 to 12.5
-95
12.5 to 18.6
-85
18.6
to 22
-80
*Limited by the appropriate DANL or -100
whichever is greater.
Gain Compression
1 .O
100 Hz to 22
with -5
at input mixer
Displayed Average Noise Level (Sensitivity)
0
input attenuation,
Hz RBW
100 Hz to 50
-95
50
to 1 .O MHz
-112
1 .O MHz to 2.5
-134
2.0 to 5.8
-132
5.8 to 12.5
-125
12.5 to 18.6
18.6 to 22
-114
- 1 4 0
100 Hz
Fig. 5. Specified average displayed noise level,
100 Hz to 2.5
non-preselected tuning range
10