Offset center, Amplitude – Atec Agilent-8566B User Manual
Page 10
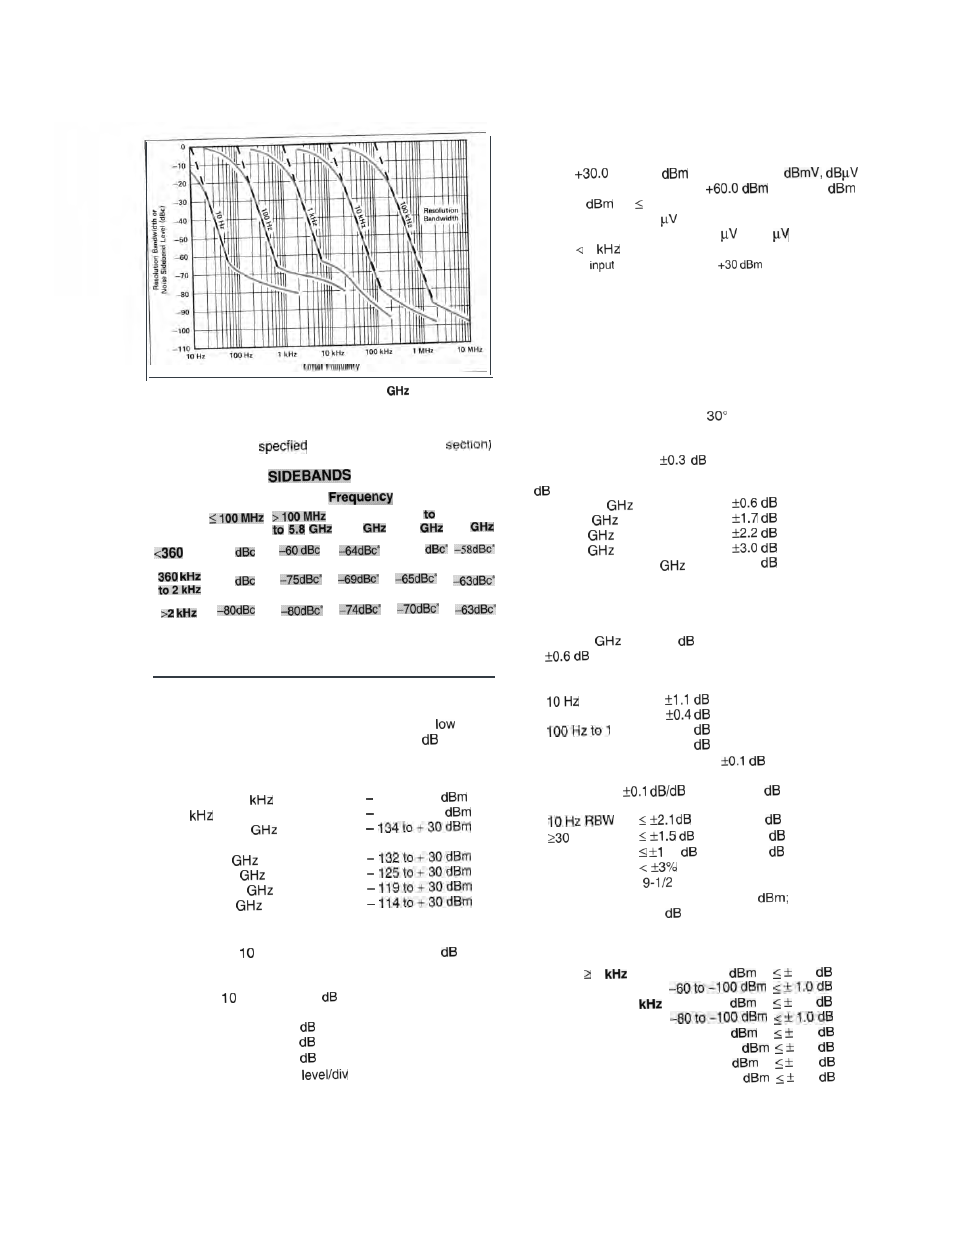
Fig. 3. Typical analyzer and SSB noise at 5.0
center
frequency. May be limited by average noise level.
Power-Line-Related Sidebands
(for line conditions
in Power Requirements
Offset
Center
from
6.8 to
12.6
18.6
to
Carrier
12.6
18.6
22
Hz -70
- 6 0
-75
Typical’
Amplitude
Measurement Range
Measurement range is the total amplitude range over which
the analyzer can measure signal responses. The
value
is determined by sensitivity (10 Hz RBW and 0
RF input
attenuation) and the high value by damage level.
Tuned Frequency
Range
Non-preselected
100 Hz to 50
95 to + 30
50
to 1 MHz
112 to + 30
1 MHz to 2.5
Preselected
2.0 to
5.8
5.8
to
12.5
12.5 to 18.6
18.6
to 22
Displayed Values
Scale (over a
division CRT vertical axis with 0
reference level at top graticule line)
Calibration
Log
dB/div for 90
display from reference level.
Expanded from reference level:
5 dB/div for 50
display
2 dB/div for 20
display
1 dB/div for 10
display
Linear 10% of ref
when calibrated voltage
Reference Level
Range
Log
to -99.9
or equivalent in
volts. Readout expandable to
to -119.9
(-139.9
for 1 kHzRBW)*
Linear 7.07 V to 2.2
full scale. Readout
expandableto 223.6 V to 2.2
(0.22
for 1
RBW)*
*
Maximum total
power not to exceed
damage level
Accuracy
The sum of the following factors determines the accuracy of
the reference level readout. Measurement technique used
after calibration with CAL signal determines applicability of
uncertainty sources. Specifications given with preselector
tracking optimized using MARKER PRESELECTOR PEAK.
With corrected readout (SHIFT W and SHIFT X executed
just prior to measurement), 20” to
C temperature range,
and minimum one hour warmup time.
Calibrator Uncertainty
Frequency Response (Flatness) Uncertainty
(10
attenuation)
100 Hz to 2.5
2.0
to 12.5
12.5 to 20
20 to 22.0
Cumulative, 100 Hz to 20
f2.2
Absolute Amplitude Calibration Uncertainty
The uncertainty of setting the frequency response
curve absolutely when using the internal
CAL signal or other calibration signal in the
100 Hz to 2.5
band (10
input attenuation).
Resolution Bandwidth Switching Uncertainty
Referenced to 1 MHz RES BW
30 Hz
MHz
f0.2
3 MHz
f0.2
Log Scale Switching Uncertainty
Log Fidelity
Incremental
over 0 to 80
display
Cumulative
over 0 to 90
Hz RBW
over 0 to 90
.O
over 0 to 80
Linear Fidelity
of reference level over top
divisions of the display
IF Gain Uncertainty Reference to -10
reference level with 10
input attenuation.
Reference Level
RBW 3
0 to -59.9
0.3
RBW 100 Hz-l
0 to -79.9
0.3
RBW 30 Hz
0 to -79.9
0.3
-80 to -100
2.0
RBW 10 Hz
0 to -79.9
1 .O
-80 to -100
2.0