Logging software – bz-7224 – Atec Bruel-Kjaer-2250-2270 User Manual
Page 8
8
Fig. 10
Tone Assessment
BZ-7231 showing
1/3-octave bands with
audible tones over a
set limit (identified by
the blue dots)
Tone Assessment – BZ-7231
Tone Assessment (optional application) identifies any 1/3-octave bands
with audible tones above a set limit. The assessment is based on the
band’s prominence versus adjacent bands. The adjustment is the penalty
to add to L
Aeq
.
Annoying tones in the spectrum may be assessed according to the
ISO 1996 standard. The level of each 1/3-octave band is compared to
the level of its neighbours, and all tones as well as the overall penalty
(adjustment) are indicated. The search parameters are user adjustable to
suit national requirements.
NOTE: With the Tone Assessment option, the FFT Analysis application
offers objective indication of tonal noise audibility and annoyance. For
details, please refer to
Logging Software – BZ-7224
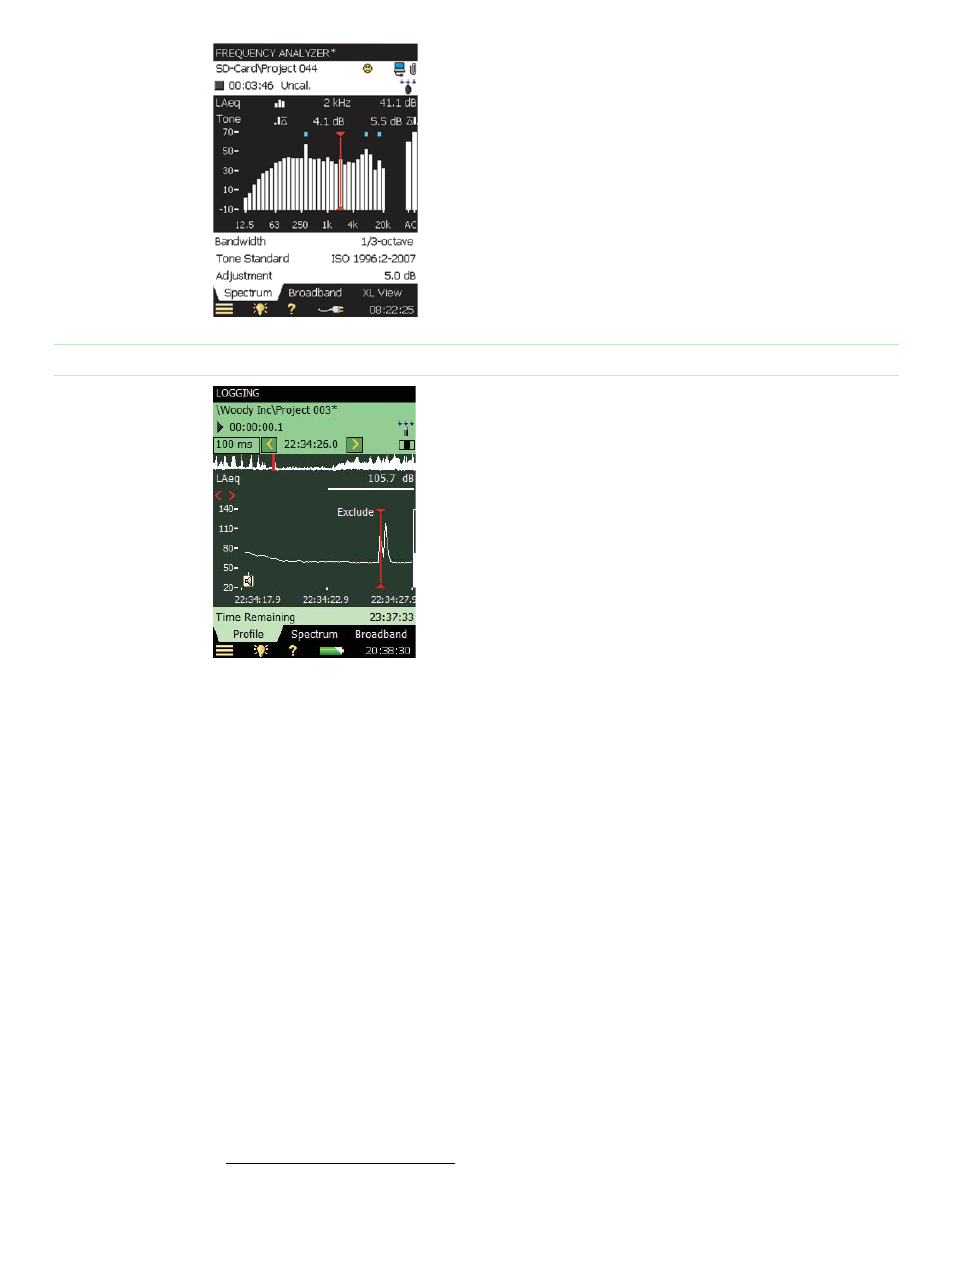
Fig. 11
Display showing part of
profile with 100 ms
resolution
With the optional Logging Software enabled, your analyzer becomes a
versatile instrument for obtaining time histories. Logging Software allows
you to select freely among the broadband parameters and log them at
intervals from 1 s to 24 h. At the same time L
Aeq
and/or L
AF
can be
logged at 100 ms intervals.
If Frequency Analysis Software BZ-7223 is enabled, the Logging
Software additionally lets you log spectra at the same 1 s to
24 h intervals.
Logging Software BZ-7224 incorporates a number of features designed
to make difficult field work as manageable as possible.
Some of these features are:
• Five user-definable markers can be set on-the-fly in the profile. Use these, for example, to clearly indicate
specific noise sources
• Markers can be set directly on the profile display using the stylus and the touch screen. Simply ‘tap and
drag’ on the part of the profile you want to mark and select a marker from the drop-down list
• Markers can even be set after the fact. The display covers the latest 100 samples (100 s of profile when
logging at 1 s intervals, otherwise more), so in most cases, you can wait for the event (or disturbance) to
end before placing your marker. Alternatively, scroll back in the profile and set your marker
• Browse easily between markers (like signal recordings)
• The profile display can be ‘frozen’ at any time (this happens automatically when you tap the screen),
allowing you to work at ease
• Voice annotations, using the commentary microphone, are attached to the exact point on the profile
where the annotation is made. With the microphone on an extension cable, comments can be associated
with particular parts of the profile without interfering with the measurement
All markers and annotations are saved with the measurement. No further bookkeeping is required. When
importing data into Measurement Partner Suite BZ-5503 for further analyses, markers, as well as
annotations, are directly accessible on the profile.
Data are stored directly on SD cards. BZ-7224 includes a suitable SD card. Data can be directly read from
the SD card by Measurement Partner. This means that even large amounts of data can be quickly
transferred to a PC. Examples of the required memory follow (values should be compared to the standard
size of the SD cards used, which start at 2 GB):
• Five broadband parameters, no statistics: 1 Mbyte
*
• All broadband parameters, one 100 ms parameter: 7 Mbyte
• All broadband parameters, one 100 ms parameter, all 1/3-octave spectra: 35 Mbyte
• All broadband parameters, one 100 ms parameter, all 1/3-octave spectra, full statistics: 88 Mbyte
*
These examples use values for 1 s logging periods for 24 h. Other values easily compute from these. Space needed for annotations and
recordings must be added to this (10 s of voice annotation requires approximately 312 kB).