Display capabilities, Appearance, Data display – Atec Bruel-Kjaer-2250-2270 User Manual
Page 6
6
Display Capabilities
As a user, you have several ways of tailoring the display to suit your specific needs. However, standard
display elements are used to ensure uniformity, not only across different applications, but also across
different users, setups and preferences. Once you have set up your measurement and display parameters
the way you wish, you can save the setup in user-defined templates.
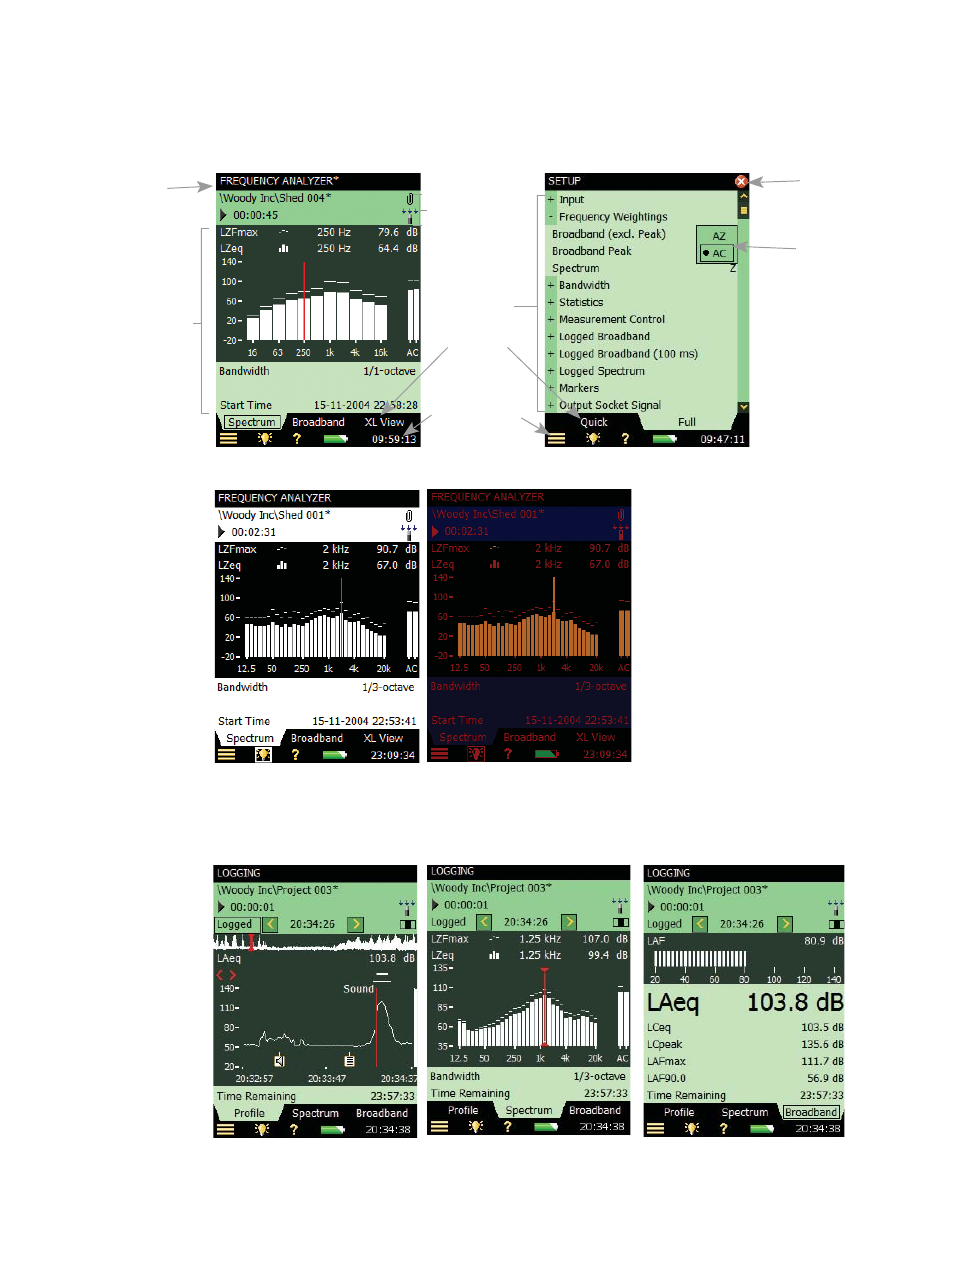
Fig. 5 Typical display when (Left) measuring and (Right) modifying/updating the measurement setup.
Appearance
Fig. 6
Alternative display
colour schemes – the
left-hand display
shows the maximum-
contrast bright sunlight
display. The right-hand
display shows the night
time display, which is
optimised to take into
account the physiology
of human vision,
allowing you to read
the display without
ruining your night
vision.
The analyzer applies a default color
scheme for the display, as seen in most
examples in this data sheet. However,
you can adjust color schemes to suit
your needs – for example, for very
bright light (where maximum contrast
is needed) or for night-time use
(where no interference with night-vision
is wanted).
Data Display
The analyzers make a distinction between the measurement made and how it is displayed. The anazlyzers
measure all quantities in parallel; however, you can choose to view any measured quantity during or after
measurement without affecting your measured data.
Fig. 7
Logging Software
BZ-7224 displays
(from left to right):
Profile with online
sound marker, spoken
commentary and note;
current spectrum; and
current broadband
values.
Select freely between
these displays at any
time
For example, if logging broadband values and spectra, you can observe the profile, time history, overall or
current spectrum, or overall or current broadband values. The display choice has no influence on what is
measured or stored.
View area:
• Contains all the parameters
and results in numerical or
graphical format
• More than one view can be
used for displaying the in-
formation
• Select view using the View
Tabs at bottom of view area
Selected project template
(including display and
measurement setup)
Status field:
• Path and name of
current project
• Immediate textual
feedback when
pressing buttons
• Information on
measurement
status
Shortcut bar:
• Main menu button,
brightness adjust,
help, battery level,
clock
View tabs
View area
Close and return to
measurement
Parameter values:
• Changed via
drop-downs
• Active element
is highlighted