Saving data, Loading jaz data into spectrasuite – Ocean Optics Jaz Absolute Irradiance User Manual
Page 22
4: Operation
16
JAZ-A-IRRAD-02-201011
Quick Tips:
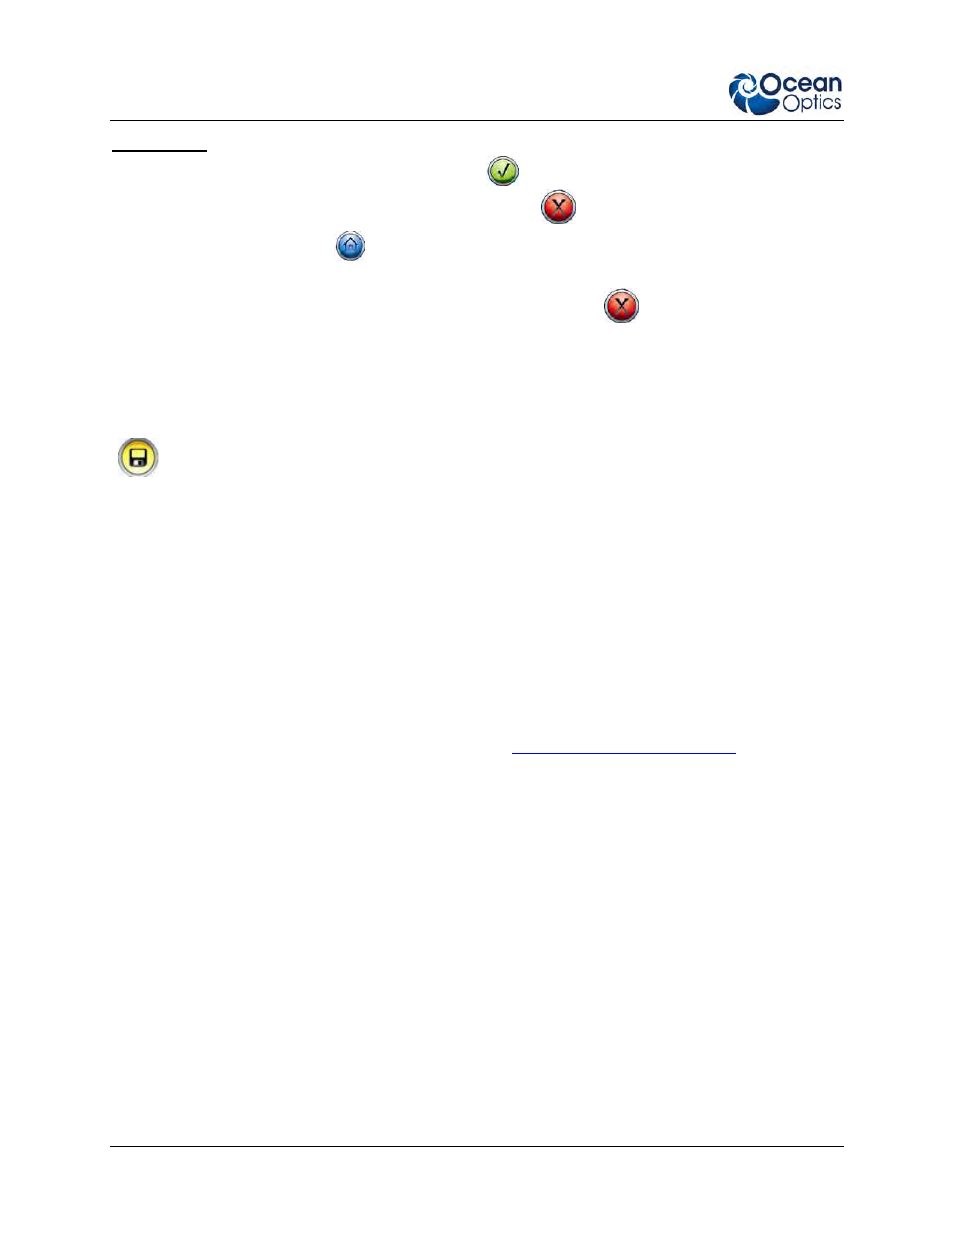
To adjust the graph display, press the Accept (
) button. Auto scaling, X and Y axis scaling
and number display can be set here. Press the Cancel (
) button to go back to the graph.
Press the Home button (
) button to go back to the Absolute Irradiance main menu to adjust
the measurement conditions.
From the Absolute Irradiance main menu, pressing the Cancel (
) button takes you to the Jaz
main menu where Jaz settings can be changed (display rotation, network configurations, etc.).
Saving Data
At any time while the screen is displaying the graph, you can store data on the SD card using the Save
(
) button. A file will be created with a filename based on your settings inside the config.txt file.
This file contains the following data:
W: Wavelength [nm]
S: Sample or Raw data measurement (in counts)
D: Dark measurements data (in counts)
P: Processed measurement data (in uW/cm
2
/nm). You can use this in your post processing.
Calibration data of your spectrometer
SpectraSuite can read this file to perform post-processing of the data. Using SpectraSuite, you can
calculate power parameters such as lumen, lux, watt, watt/m, joules, PAR, etc. Also, you can derive color
parameters such as CIE values, CRI values, x,y,z, etc. See the SpectraSuite Installation and Operation
Manual for more information about these parameters (see
Loading Jaz Data into SpectraSuite
Once you have collected your measurement data on the SD card, you can load this data into SpectraSuite
for further processing. These files that you have stored on your SD card have the extension
*.JAZZIRRAD.
►
Procedure
1. Navigate to Processing | Absolute Irradiance | Load Jaz Absolute Irradiance Measurement.
Once the file is loaded, SpectraSuite automatically opens a graph of the Absolute Irradiance
Measurement data. The data file appears in the Data Sources pane. From here, you can display
the raw data or save to a diffrerent file format.
2. Once the graph is displayed, you can start a color analysis, radiometric analysis, or photometric
analysis of the spectrum by selecting the appropriate icons as shown below: