Ocean Optics Red Tide Guide User Manual
Page 9
170-00000-RT-02-1108
9
CALIBRATE FROM SOLUTIONS OF KNOWN
CONCENTRATION
(Also see the SpectraSuite manual for more information. )
Go to File>New>New Concentration Measurement
This time click the radio button
Calibrate from solutions of known concentration.
See Fig.21.
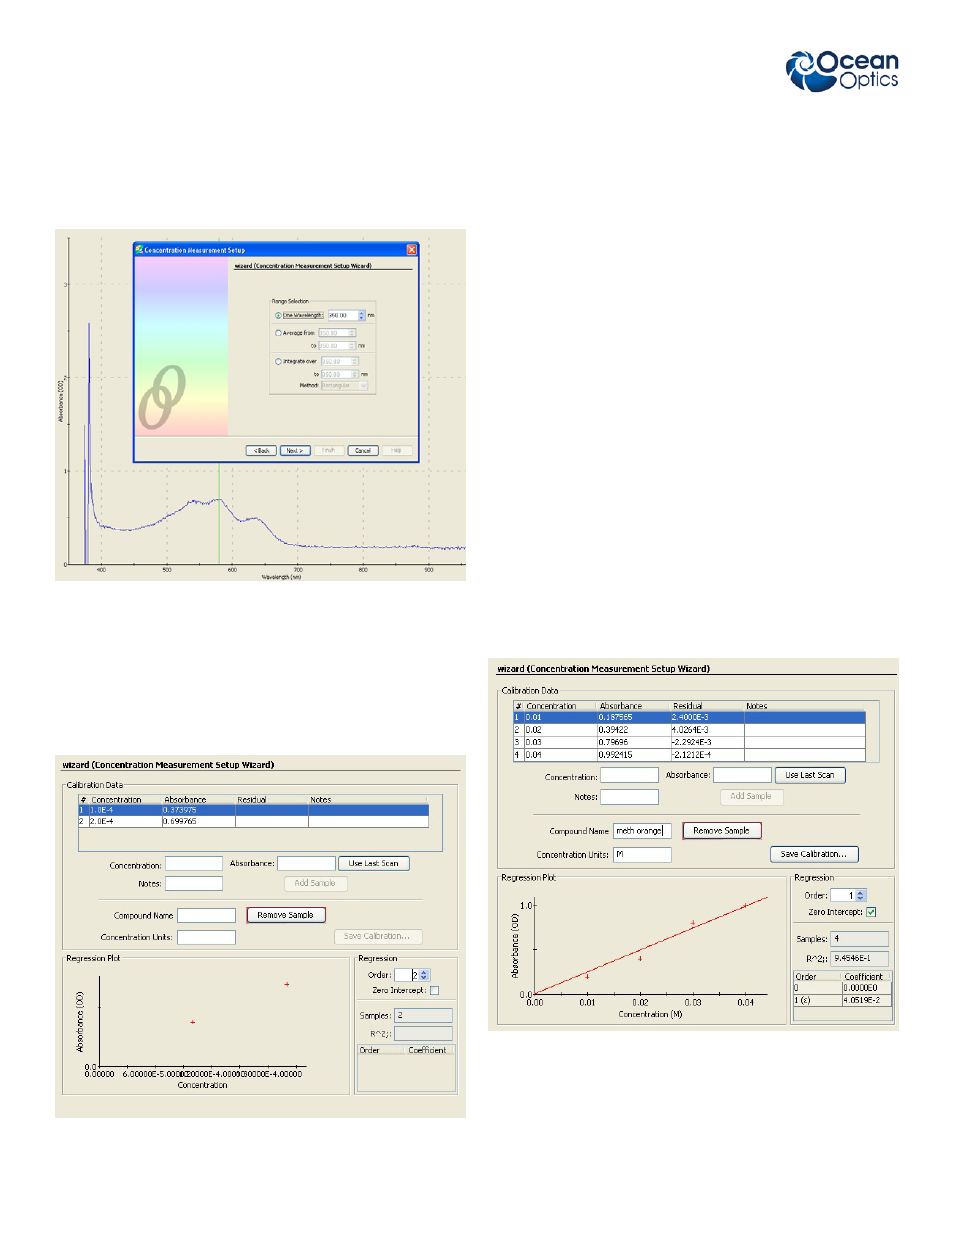
Fig.24
Select a single wavelength, average, or integral over a
range. A single wavelength would normally be the maxi-
mum absorbance wavelength for the solution,λ
max,
but a
range of wavelengths can give a more reliable result. See
Fig. 24.
Click Next.
Put your known concentration sample in the cuvette
holder. Enter the concentration, using mathematical nota-
tion E–4 ,for example, to indicate x 10
–4
Click Use Last Scan to enter the Absorbance for that
sample automatically, or key in the value.
Click Add Sample to add the plot point to the Regression
Plot.
Click Remove Sample to remove an unwanted sam-
ple.
Fig. 25
When you have two or more plot points (the more the bet-
ter), select the regression order and check zero intercept
( zero concentration = zero absorbance)
as required to
plot a regression line.
The slope of the line is ε ( be careful with units and
magnitudes).
The R
2
(R^2) value is a measure of how well the
regression line fits to your points. The closer it is to 1.0,
the better the fit.
SpectraSuite also caculates the Residual, which is the
difference between the line and the plot point and should
be very small if the fit is good.
Fig.26