Ocean Optics Red Tide Guide User Manual
Page 5
170-00000-RT-02-1108
5
SPECTRUM I/O
Overlays
An overlay is a spectrum trendline that is not active, but
placed in the active graph for comparison. You can create
instant overlays using the Convert Active Spectrum to
overlay icon (see Fig. 9). You can also add saved spectra
as overlays and selectively delete overlays.
As overlays are not active spectra, they cannot be saved
to file. To save a screen with overlays, use the
File>Screen Capture
command.
Fig. 8
Spectrum Graph
Spectrum Table
Note:
If Spectrum Graph is clicked when an active graph is al-
ready running, you will have a choice of running two ac-
tive graphs simultaneously. This should not be done with
one spectrometer; it causes pulsing of the strobe-lamp
and data will be corrupted.
Fig. 9
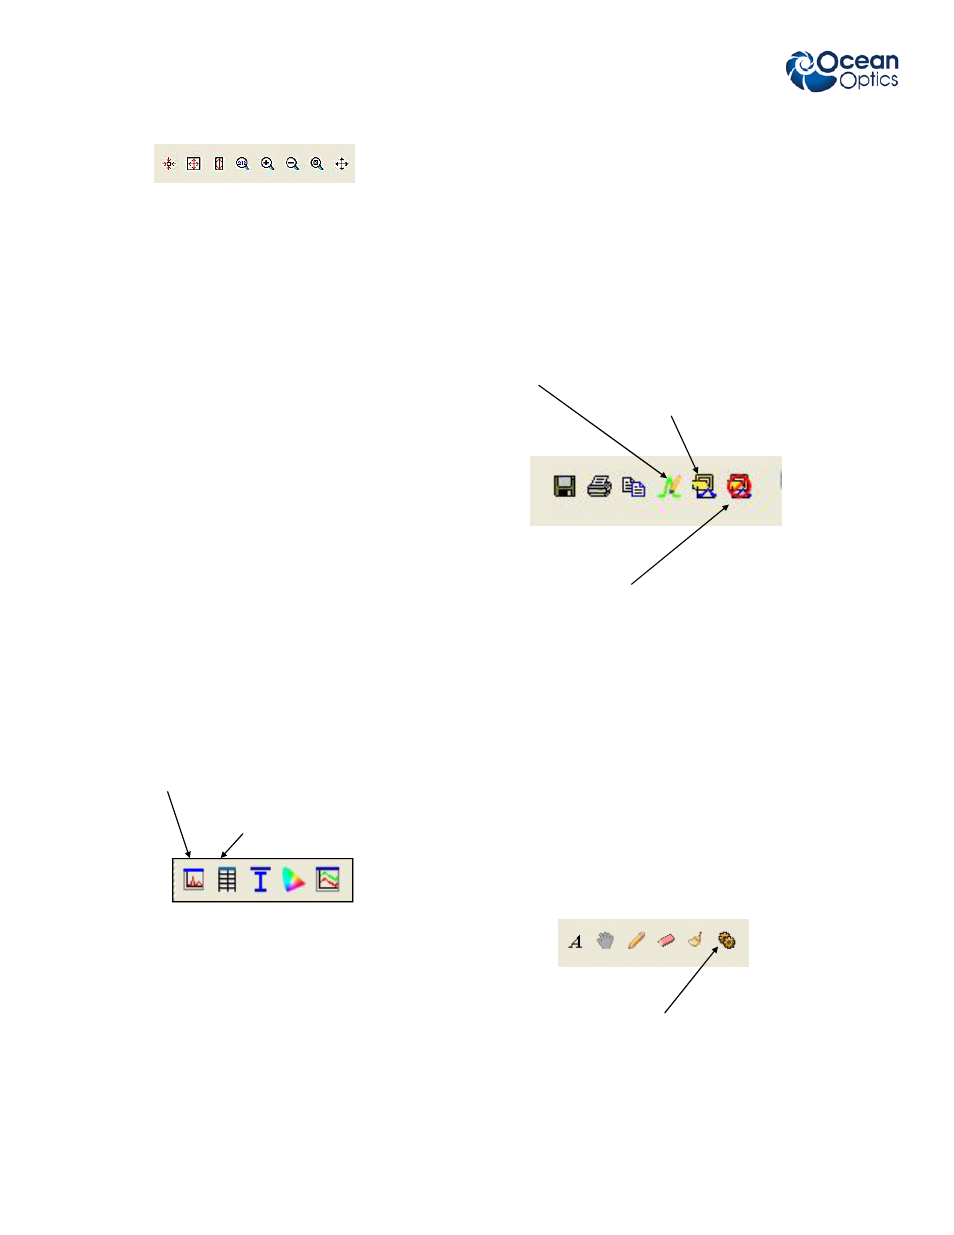
Convert Active Spectrum to Overlay
Load Overlay from File
Delete Overlays
LAYER TOOLBAR
The Layer toolbar allows annotations and drawing to be
made over a graph. These are not spectral data and can
only be saved by using the File>Screen Capture com-
mand.
Fig. 10
Graph Layer Options
The Graph Layer Options icon opens the Graph Layer
Options window ( Fig. 11) for the active graph. You can
also reach this by right clicking anywhere on the graph.
GRAPH CONTROLS
These icons all have tool tips. Hold the cursor over each
to see its function.
1.
Zoom to maximum. Useful “home” control if you get
lost.
2.
Scale graph to fill window.
3.
Scale graph height to fill window. Useful for magni-
fying small y-axis detail.
4.
Set axes ranges manually. Useful if you just want to
study a limited waveband.
5. Zoom
in.
6. Zoom
out.
7.
Zoom to a selected region. Useful for looking at fine
detail.
8. Graph
panning.
1 2 3 4 5 6 7 8
Fig. 7
ACQUISITION CONTROLS
Use the Spectrum Graph icon to create a new graph in
Scope mode. Until you do this all the tools are grayed out.
Spectrum Table launches a live numeric data table for
export to spreadsheet applications.