Teccor, Brand thyristors, Standard bidirectional sidacs – Littelfuse Kxxxzy SIDAC User Manual
Page 3: Figure 1: v-i characteristics, Figure 4: repetitive peak on-state current (i, Vs. pulse width at various frequencies, Figure 5: peak non-repetitive surge current (i, Vs. number of cycles figure 6: normalized v, Change vs. junction temperature
341
Revised: 09/23/13
©2013 Littelfuse, Inc
Specifications are subject to change without notice.
Teccor
®
brand Thyristors
Standard Bidirectional SIDACs
Kxxxzy Series
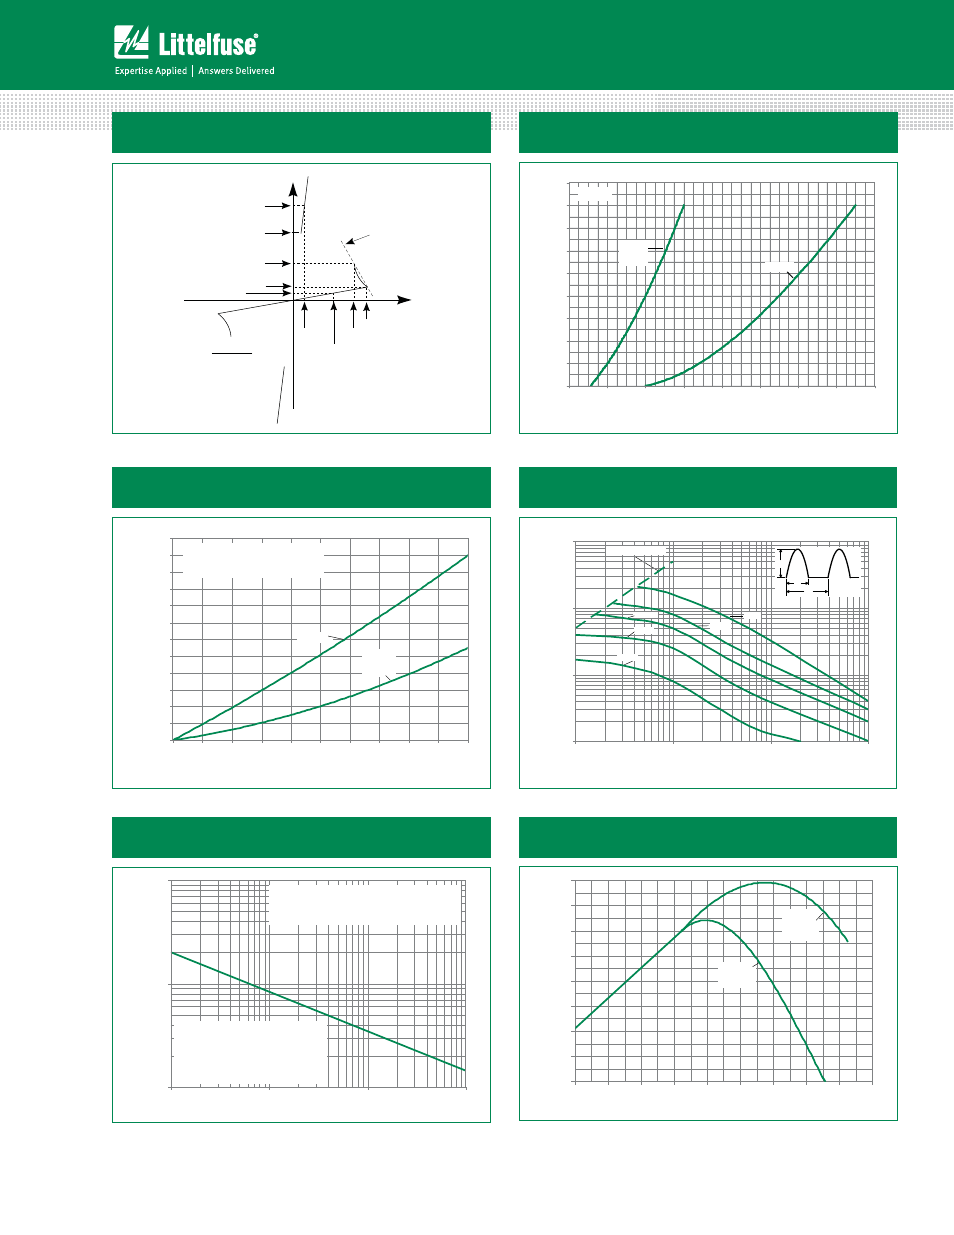
Figure 1: V-I Characteristics
-V
+I
V
DRM
+V
V
S
I
S
I
H
R
S
I
DRM
I
BO
V
BO
V
T
I
T
(I
S
- I
BO
)
(V
BO
- V
S
)
R
S =
-I
0
1
2
3
4
5
6
7
8
9
0.6
1.0
1.4
1.8
2.2
2.6
3.0
3.4
3.8
Instantaneous On-state Voltage (v
T
) – Volts
n
stantaneous On-stat
e Cur
rent (i
T
) –
Amps
Kxxx2G
Kxxx0G
Kxxx0E
Kxxx0S
T
J
= 25°C
Figure 2: On-state Current vs. On-state
Voltage (Typical)
0.0
0.2
0.4
0.6
0.8
1.0
1.2
1.4
1.6
1.8
2.0
2.2
2.4
0.0
0.1
0.2
0.3
0.4
0.5
0.6
0.7
0.8
0.9
1.0
CURRENT WAVEFORM: Sinusoidal
LOAD: Resistive or Inductive
CONDUCTION ANGLE:
See Basic SIDAC Circuit in Figure 12
Kxxx2G
Kxxx0G
Kxxx0E
Kxxx0S
RMS On-State Current [I
T(RMS)
] - Amps
A
v
e
ra
g
e
O
n
-S
ta
te
P
o
w
e
r D
is
s
ip
a
ti
o
n
[P
D(
A
V
)
] -
W
a
tt
s
Figure 3: Power Dissipation vs. On-state Current
(Typical)
Pulse Base Width (t
O
) - us
Repetitiv
e P
eak On-Stat
e Cur
rent (I
TRM
) -
Amps
1
10
100
1000
1.0
10.0
100.0
1000.0
5 Hz
60 Hz
5 kHz
120 Hz
1 kHz
di/dt Limit Line
I
TM
t
O
1/f
Figure 4: Repetitive Peak On-state Current (I
TRM
)
vs. Pulse Width at Various Frequencies
1
10
100
1
10
100
1000
Surge Current Duration -- Full Cycles
P
eak Sur
g
e (Non-r
epetitiv
e)
On-stat
e Cur
rent (I
TSM
) –
Amps
SUPPLY FREQUENCY: 60 Hz Sinusoidal
LOAD: Resistive
RMS ON-STATE CURRENT: I
T
RMS Maximum Rated
Value at Specified Junction Temperature
Notes:
1) Blocking capability may be lost during
and immediately following surge
current interval.
2) Overload may not be repeated until
junction temperature has returned
to steady-state rated value.
Figure 5: Peak Non-repetitive Surge Current (I
TSM
)
vs. Number of Cycles
Figure 6: Normalized V
BO
Change vs. Junction
Temperature
-12%
-10%
-8%
-6%
-4%
-2%
0%
2%
4%
-40
-20
0
20
40
60
80
100
120
140
K2xx0E
K2xx0G
K2xx0S
Kxxx2G
K1xx0E
K1xx0G
K1xx0S
V
BO
Chang
e -- %
Junction Temperature (T
J
) -- °C