Varistor products, Hi–energy mo v’s, Ba/bb series – Littelfuse BA_BB Varistor Series User Manual
Page 3: Stand by power dissipation vs applied v, Vs time, Power dissipation ratings, Peak pulse current test waveform
© 2013 Littelfuse, Inc.
153
Revised: May 8, 2013
Varistor Products
BA/BB Varistor Series
Industrial High Energy Terminal Varistors > BA/BB Series
Specifications are subject to change without notice.
Please refer to www.littelfuse.com/series/ba or /bb.html for current information.
HI–ENERGY
MO
V’S
BA/BB Series
TYPICAL TEMPERATURE COEFFICIENT
OF POWER DISSIPATION = 2.2%/oC
MAX A
T
TA = 85
oC
MAX A
T
TA = 25
oC
TYP A
T
TA = 25
oC
1.0
0.8
0.6
0.4
0.2
0.1
0.08
0.06
0.04
80
90
100
110
PERCENTAGE OF MAXIMUM RATED V RMS (%)
PO
WER DISSIP
A
TION (W) PER kV
OF R
A
TED
V
RMS
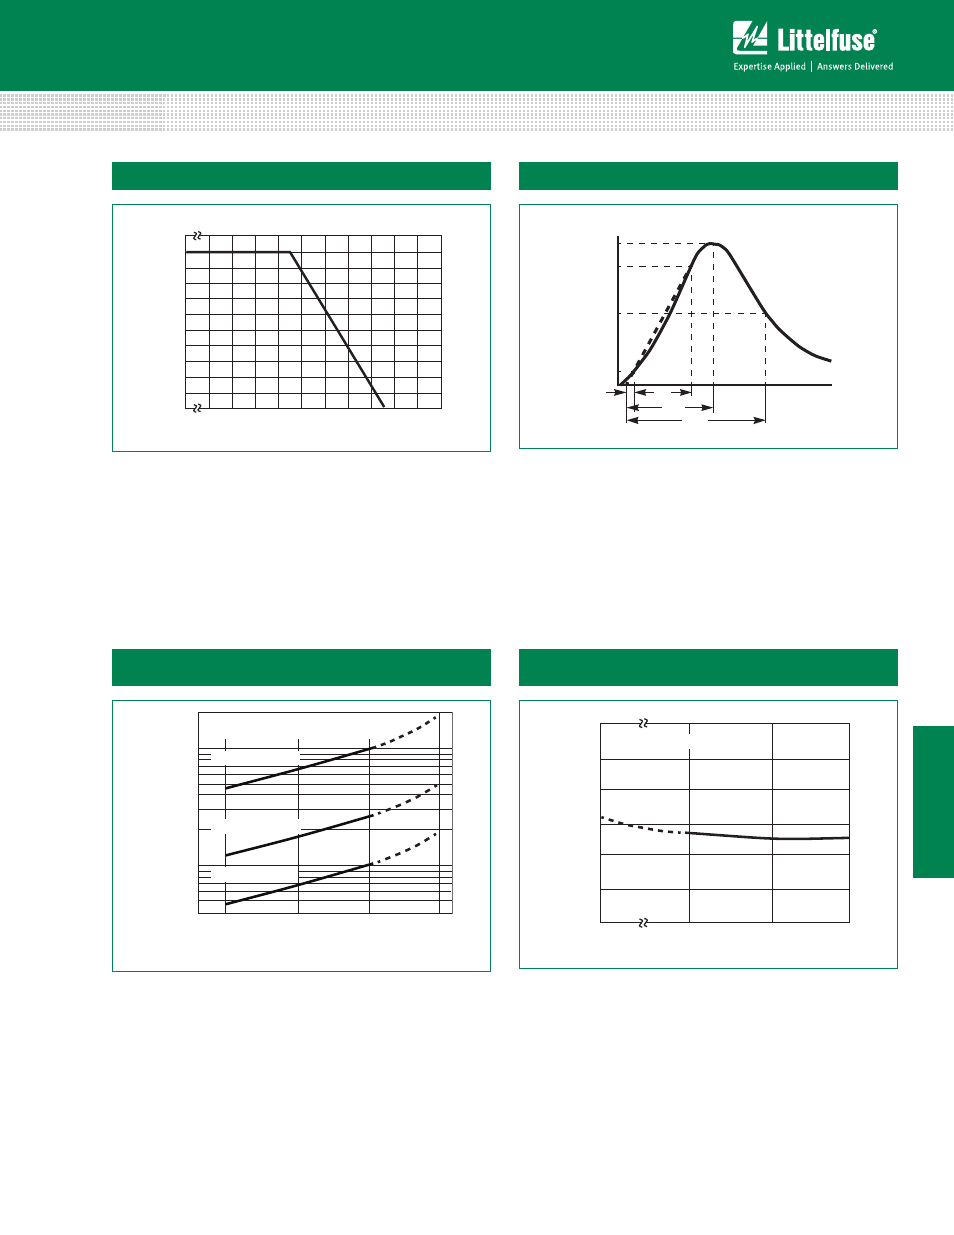
Stand by Power Dissipation vs Applied V
Rms
at Varied
Temperatures
Typical Stability of Standby Power Dissipation at Rated
V
RMS
vs Time
1,000 HOURS, TA = 85
oC
0.5
0.4
0.3
0.2
0.1
0
0
10
100
1,000
PO
WER DISSIP
A
TION (W) PER kV
OF R
A
TED
V
RMS
TIME AT RATED V RMS (HOURS)
Should transients occur in rapid succession, the average power
dissipation required is simply the energy (watt-seconds) per pulse
times the number of pulses per second. The power so developed
must be within the specifications shown on the Device Ratings
and Characteristics Table for the specific device. Furthermore,
the operating values need to be derated at high temperatures as
shown in the above diagram. Because varistors can only dissipate
a relatively small amount of average power they are, therefore, not
suitable for repetitive applications that involve substantial amounts
of average power dissipation.
Power Dissipation Ratings
100
90
80
70
60
50
40
30
20
10
0
-55
50
60
70
80
90
100
110
120
130
140 150
AMBIENT TEMPERATURE (
o
C)
PERCENT OF R
A
TED
V
ALUE
100
90
50
10
O
1
T
T
1
T
2
TIME
PERCENT OF PEAK
V
ALUE
Peak Pulse Current Test Waveform
0
1
= Virtual Origin of Wave
T = Time from 10% to 90% of Peak
T
1
= Rise Time = 1.25 x T
T
2
= Decay Time
Example - For an 8/20 μs Current Waveform:
8μs = T
1
= Rise Time
20μs = T
2
= Decay Time
Figure 1
Figure 2
Figure 3
Figure 4