Transient voltage suppression diodes, Axial leaded – 10ka > ak10 series – Littelfuse AK10 Series User Manual
Page 3
Transient Voltage Suppression Diodes
© 2014 Littelfuse, Inc.
Specifications are subject to change without notice.
Revised: 03/04/14
Axial Leaded – 10kA > AK10 series
L2
L1
A
G
D
E
F
C
C
B
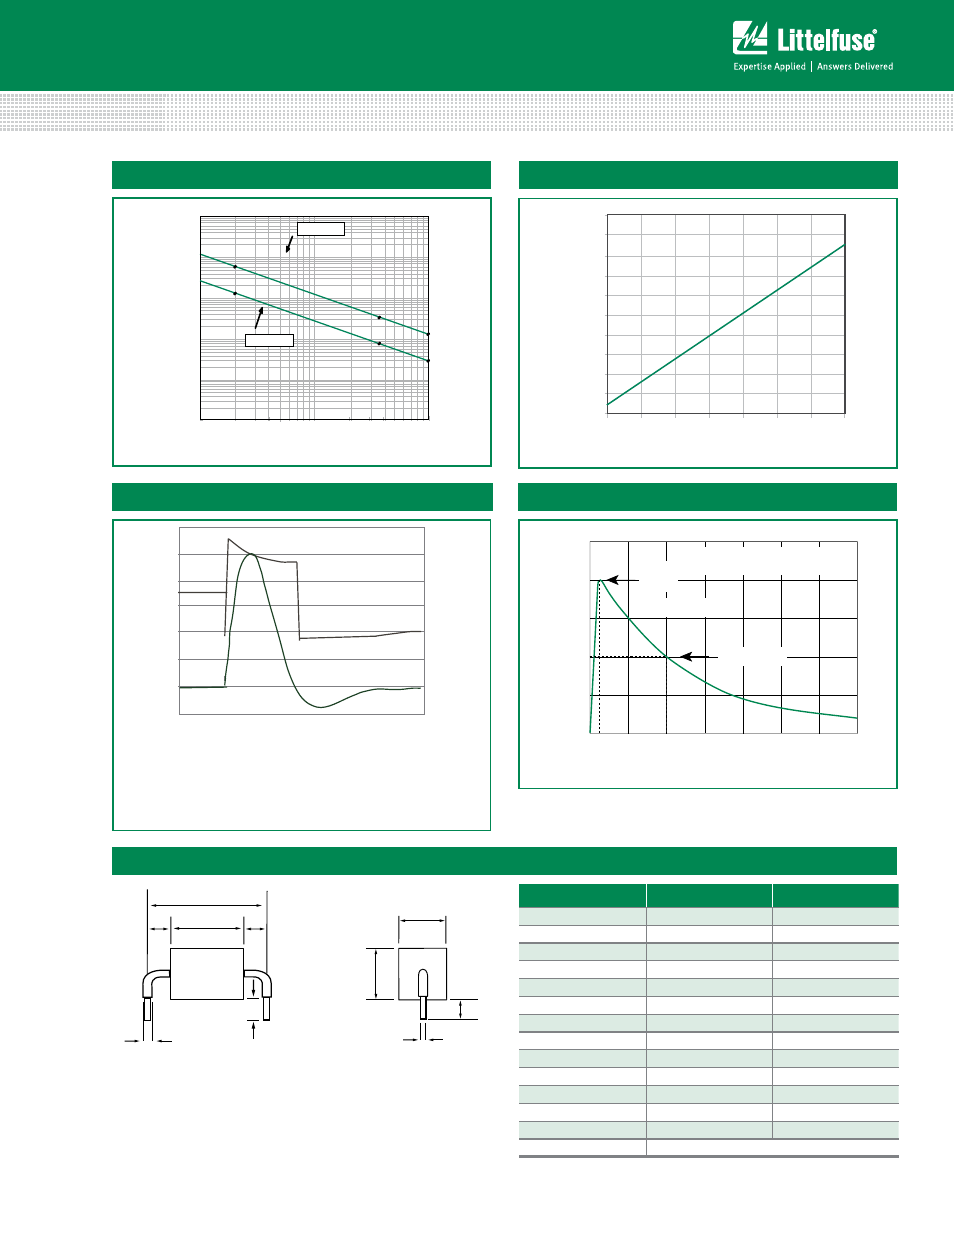
Dimensions
Inches
Millimeters
A
0.950 +/- 0.04
24.15 +/- 1.00
A - 530C
1.370 +/- 0.08
34.70 +/- 2.00
B
0.095 +/- 0.024
2.40 +/- 0.60
C
0.236 +/- 0.04
6.00 +/- 1.00
D
0.570 max.
14.48 max.
E
0.050 +/- 0.002
1.27 +/- 0.05
F
0.500 max.
12.70 max.
G - 030C
0.167 +/- 0.04
4.23 +/- 1.00
G - 058C/066C/076C
0.200 +/- 0.04
5.08 +/- 1.00
G - 170C/190C
0.362 +/- 0.04
9.20 +/- 1.00
G - 240C
0.420 +/- 0.04
10.67 +/- 1.00
G - 380C/430C
0.650 +/- 0.04
16.50 +/- 1.00
G - 530C
1.060 +/- 0.06
27.00 +/- 1.50
L1/L2
L1 = L2 tolerance +/- 0.04 inch (1.0 mm)
Dimensions
Figure 7 - Surge Response
(8/20 Surge current waveform)
Voltage
Current
Time (µs)
Notes:
The power dissipation causes a change in avalanche
voltage during the surge and the avalanche voltage
eventually returns to the original value when the
transient has passed
50
100
0
t
r
t
d
0
Peak
Value
Half Value
t – Time (µs)
I
PP
– P
eak P
ulse C
ur
ren
t – %I
PP
t
r
= rise time to peak value
t
d
= decay time to half value
t
r
x t
d
=8/20µs
Figure 8 - Pulse Waveform
1
10
100
100000
0.00001
0.0001
0.001
P
PPM
-Peak Pulse Power (kW
)
t
d
-Pulse Width (sec.)
1000
AK10-430C
10000
AK10-076C
8/20µs
10/350µs
10/1000µs
Figure 5 - Typical Peak Pulse Power Rating Curve
Figure 6 - Typical V
BR
Vs Junction Temperature
-8
-6
-4
-2
0
2
4
6
8
10
12
-50 -25
0
25
50
75
100 125
Percent of
V
BR
Change
Junction Temperature(T
j
)