Transient voltage suppression diodes, Axial leaded – 2200w > sld series, Figure 2 - peak pulse power rating curve – Littelfuse SLD Series User Manual
Page 3
Transient Voltage Suppression Diodes
© 2014 Littelfuse, Inc.
Specifications are subject to change without notice.
Revised: 01/20/14
Axial Leaded – 2200W > SLD series
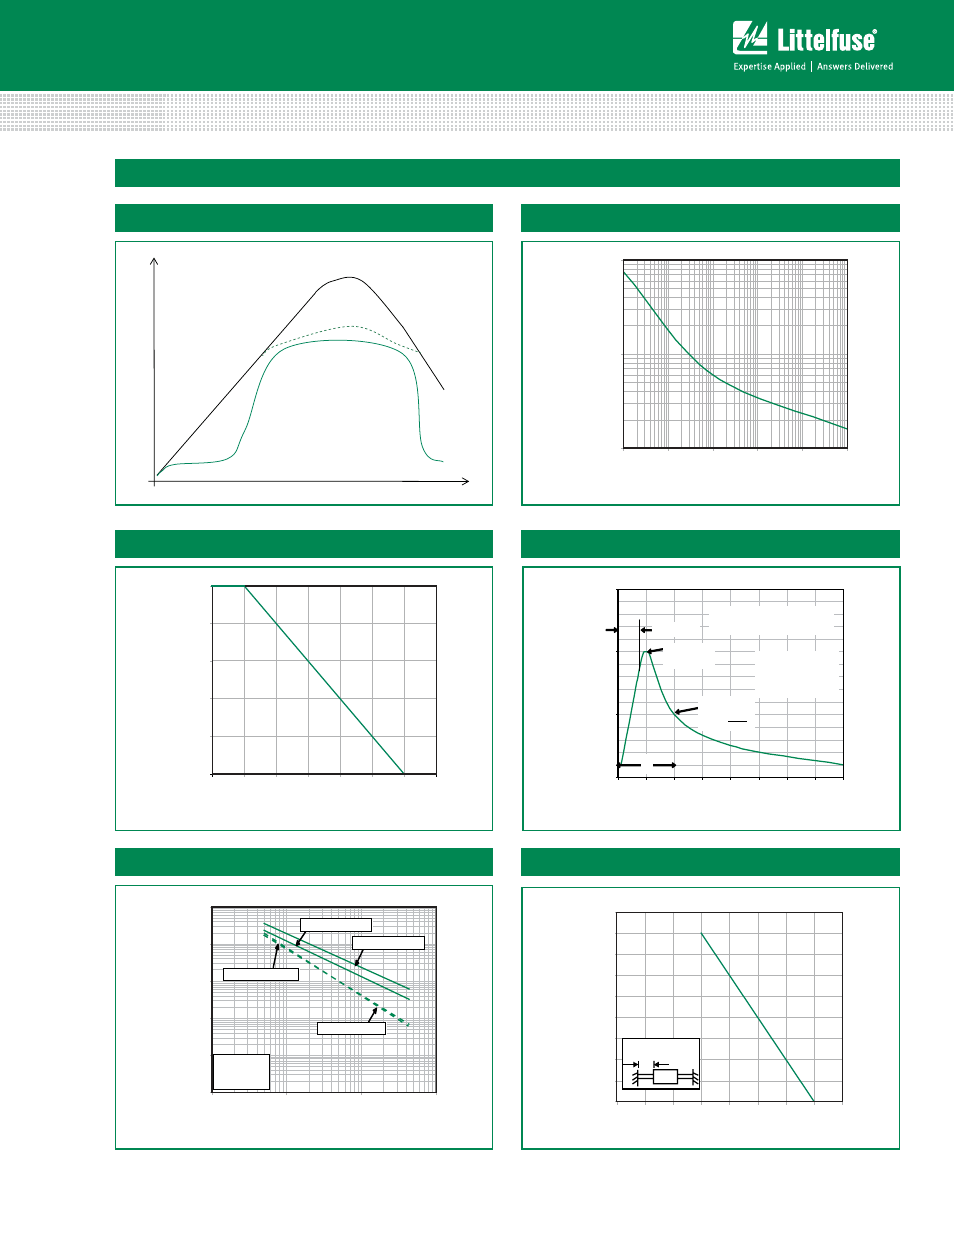
Voltage Transients
Time
Voltage Across TVS
Current Through TVS
Voltage or Current
Figure 1 - TVS Transients Clamping Waveform
Ratings and Characteristic Curves
(T
A
=25°C unless otherwise noted)
Figure 2 - Peak Pulse Power Rating Curve
continues on next page.
1
10
100
0.00001 0.0001
0.001
0.01
0.1
1
P
PPM
-Peak Pulse Power (kW
)
t
d
-Pulse Width (sec.)
0
0
150
300
450
600
50
100
150
t
d
t - Time (ms)
I
PPM
- Peak Pulse Current, %
I
RS
M
Standard Waveform 10ms x 150ms
As defined by R.E.A.
Format is usually
tr=10ms
T
j
=25ºC
Pulse Width (td) is
defined as the point
where the peak current
decays to 50% of I
PPM
tr=10ms
Peak Value
IPPM
IPPM
2
Half Value
IPPM
( )
0
20
40
60
80
100
0
25
50
75
100
125
150
175
T
A
-Ambient temperature (ºC)
Peak Pulse Power (P
PP
) or Current (I
PP
)
Derating in Percentage
%
1
10
100
1000
10000
100000
1
10
100
1000
Tj=25C
f=1.0MHz
Vsig=50mVp-p
V
BR
- Reverse Breakdown Voltage (V)
Cj (pF)
Uni-directional @ V
R
Bi-directional @ V
R
Bi-directional V=0V
Uni-directional V=0V
0
1
2
3
4
5
6
7
8
9
0
25
50
75
100 125 150 175 200
T
L
- Lead Temperature(ºC)
Steady State Power Dissipation (W
)
L = 0.375” (9.5mm)
Lead Lengths
Figure 3 - Pulse Derating Curve
Figure 4 - Pulse Waveform
Figure 5 - Typical Junction Capacitance
Figure 6 - Steady State Power Derating Curve