Varistor products, Hi–energy mo v’s – Littelfuse HG34 Varistor Series User Manual
Page 5
© 2013 Littelfuse, Inc.
171
Revised: May 8, 2013
Varistor Products
HB34, HF34 and HG34 Varistor Series
Industrial High Energy Terninal Varistors > HB34, HF34 & HG34 Series
Specifications are subject to change without notice.
Please refer to www.littelfuse.com/series/hb34.html or /hf34 or /hg34.thml
for current information.
HI–ENERGY
MO
V’S
HBx/HFx/HGx Series
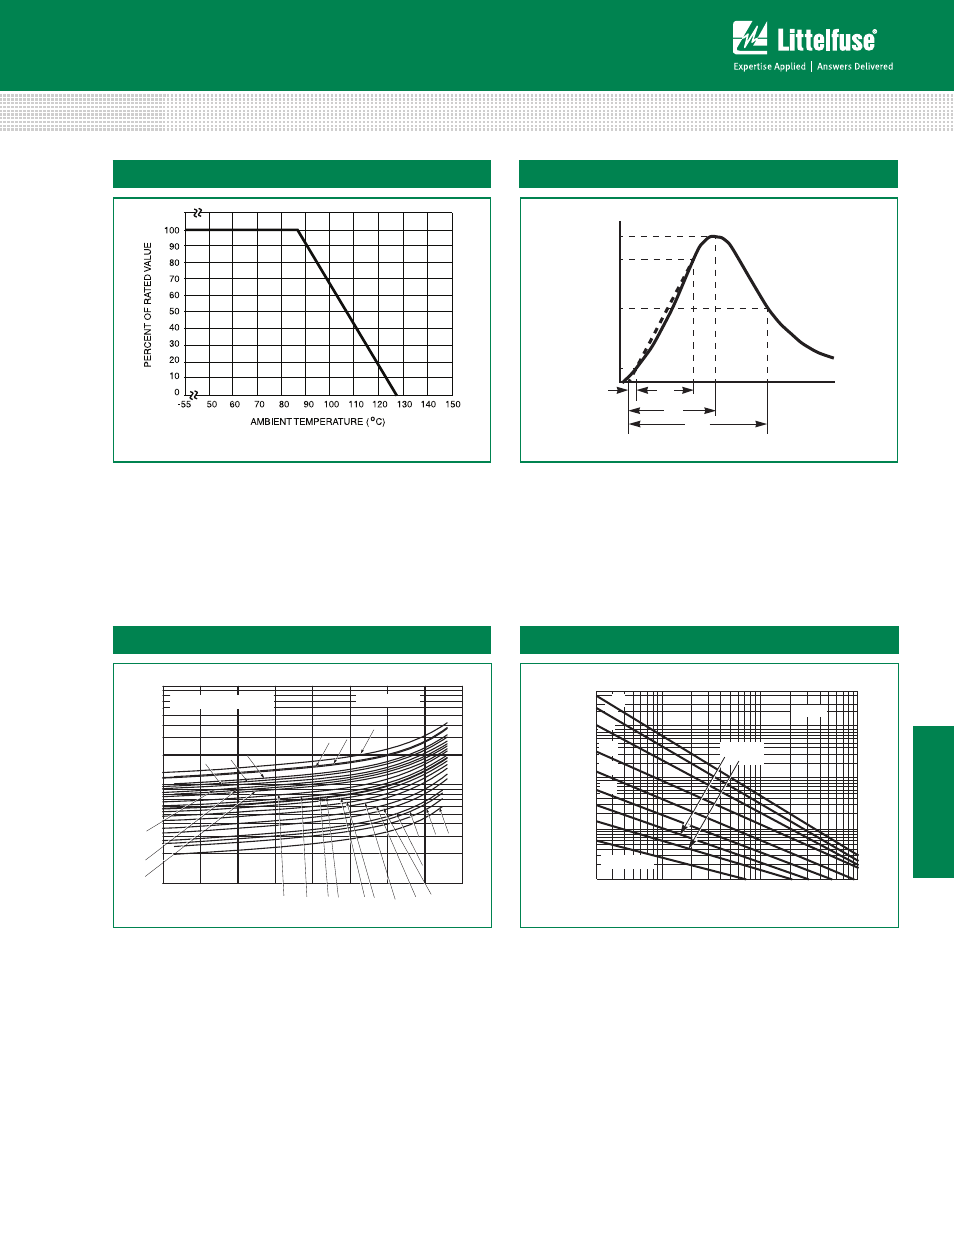
Should transients occur in rapid succession, the
average power dissipation result is simply the energy
(watt-seconds) per pulse times the number of pulses
per second. The power so developed must be within
the specifications shown on the Device Ratings and
Specifications Table for the specific device. The operating
values must be derated as shown in above.
Power Dissipation Ratings
100
90
50
10
O
1
T
T
1
T
2
TIME
PERCENT OF PEAK
V
ALUE
Peak Pulse Current Test Waveform
Clamping Voltage for HB34, HF34 and HG34 Series
1000
10000
1mA
10mA
100mA
1A
10A
100A
10000A
100000A
Maximum Clamping Voltage
HB34, HF34, and HG34 series
TA = -55 C to 85C
Current - AMPS
Voltage -
VOLTS
V751
V681
V661
V571
V551
V511
V391
V351 V331 V321
V271
V251 V201 V181
V151
V141
V111
V131
V301
V481
V441
V421
100
1000A
Surge Current Rating Curves for HB34, HF34 and HG34 Series
Hx34
50,000
20,000
10,000
5,000
2,000
1,000
500
200
100
50
20
10
20
100
1,000
10,000
SUR
GE CURREN
T
(A)
IMPULSE DURATION ( μs)
15
1
INDEFINITE
105
102
2
103
104
106
NOTE: If pulse ratings are exceeded, a shift of V
N(DC)
(at specified current) of more than
+/-10% could result. This type of shift, which normally results in a decrease of V
N(DC)
, may
result in the device not meeting the original published specifications, but it does not
prevent the device from continuing to function, and to provide ample protection.
0
1
= Virtual Origin of Wave
T = Time from 10% to 90% of Peak
T
1
= Rise Time = 1.25 x T
T
2
= Decay Time
Example - For an 8/20 μs Current Waveform:
8μs = T
1
= Rise Time
20μs = T
2
= Decay Time
Figure 1
Figure 2
Figure 3
Figure 4