Varistor products – Littelfuse RA Varistor Series User Manual
Page 3
© 2013 Littelfuse, Inc.
195
Revised: May 8, 2013
Varistor Products
RA Varistor Series
Low Profile / Application Specific Varistors > RA Series
Specifications are subject to change without notice.
Please refer to www.littelfuse.com/series/ra.html for current information.
RA Series
Part
Number
Brand
Maximum Rating (125°C)
Specifications (25°C)
Continuous
Transient
Varistor Voltage at 1mA
DC Test Current
Max Clamping
Volt V
C
at 2.0A
(8/20μs)
Typical
Capacitance
V
RMS
V
DC
Energy
(10/1000μs)
Peak
Current
(8/20μs)
V
M(AC)
V
M(DC)
W
TM
I
TM
Min
V
N(DC)
Max
V
C
I
p
f = 1MHz
(mm)
(V)
(V)
(J)
(A) (V)
(V)
(V)
(V)
(A)
(pF)
† RA22 Series
V24RA22
24R22
14
18
(Note 3)
100.0
(Note 2)
2000
19.2
24
(Note 4)
26
43
20
18000
V36RA22
36R22
23
31
160.0
(Note 2)
2000
32
36
(Note 4)
40
63
20
12000
† V200RA22
200R22
130
175
70.0
6500
184
200
228
340
100
1900
† V240RA22
240R22
150
200
80.0
6500
212
240
268
395
100
1600
† V270RA22
270R22
175
225
90.0
6500
247
270
303
455
100
1400
† V390RA22
390R22
250
330
130.0
6500
354
390
429
650
100
1000
† V430RA22
430R22
275
369
140.0
6500
389
430
473
710
100
900
RA Series Ratings & Specifications
NOTES:
1. Average power dissipation of transients not to exceed 0.25W for RA8 Series, 0.60W for RA16 Series, or 1.0W for RA22 Series.
2. Energy ratings for impulse duration of 30ms minimum to one half of peak current value.
3. Also rated to withstand 24V for 5 minutes.
4. 10mA DC Test Current.
† Under UL File No. E320116 as a recognized component. CSA approved File No. LR91788.
Should transients occur in rapid succession, the average power
dissipation required is simply the energy (watt-seconds) per pulse
times the number of pulses per second. The power so developed
must be within the specifications shown on the Device Ratings
and Specifications table for the specific device. Furthermore,
the operating values need to be derated at high temperatures as
shown above. Because varistors can only dissipate a relatively
small amount of average power they are, therefore, not suitable
for repetitive applications that involve substantial amounts of aver-
age power dissipation.
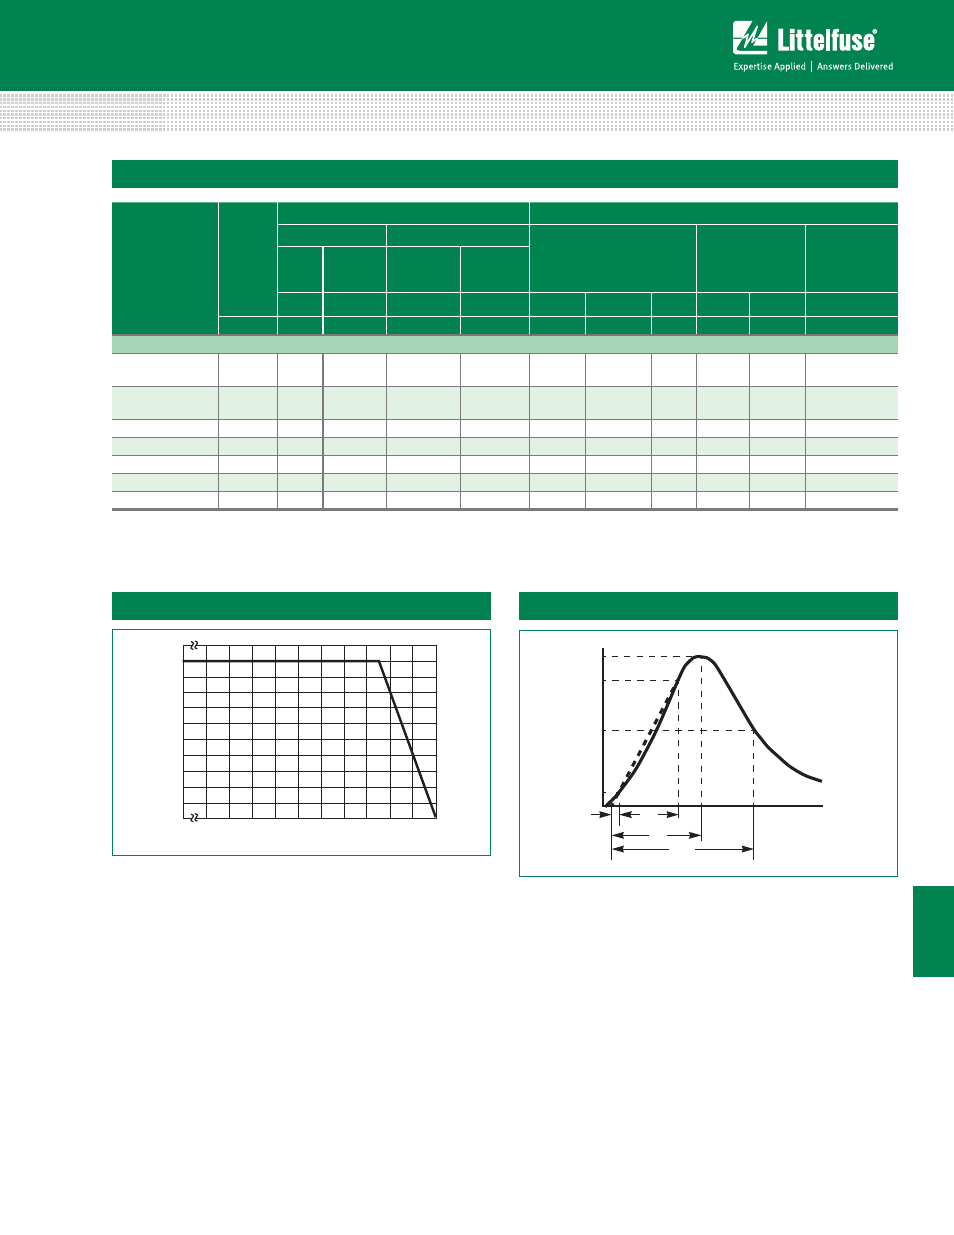
Power Dissipation Ratings
100
90
50
10
O
1
T
T
1
T
2
TIME
Peak Pulse Current Test Waveform
0
1
= Virtual Origin of Wave
T = Time from 10% to 90% of Peak
T
1
= Rise Time = 1.25 x T
T
2
= Decay Time
Example - For an 8/20 μs Current Waveform:
8μs = T
1
= Rise Time
20μs = T
2
= Decay Time
100
90
80
70
60
50
40
30
20
10
0
-55
50
60
70
80
90
100
110
120
130
140
150
AMBIENT TEMPERATURE (
o
C)
PERCENT OF R
A
TED
V
ALUE
Figure 1
Figure 2