Ccd output waveform timing chart – Toshiba IK-TF5U User Manual
Page 33
33
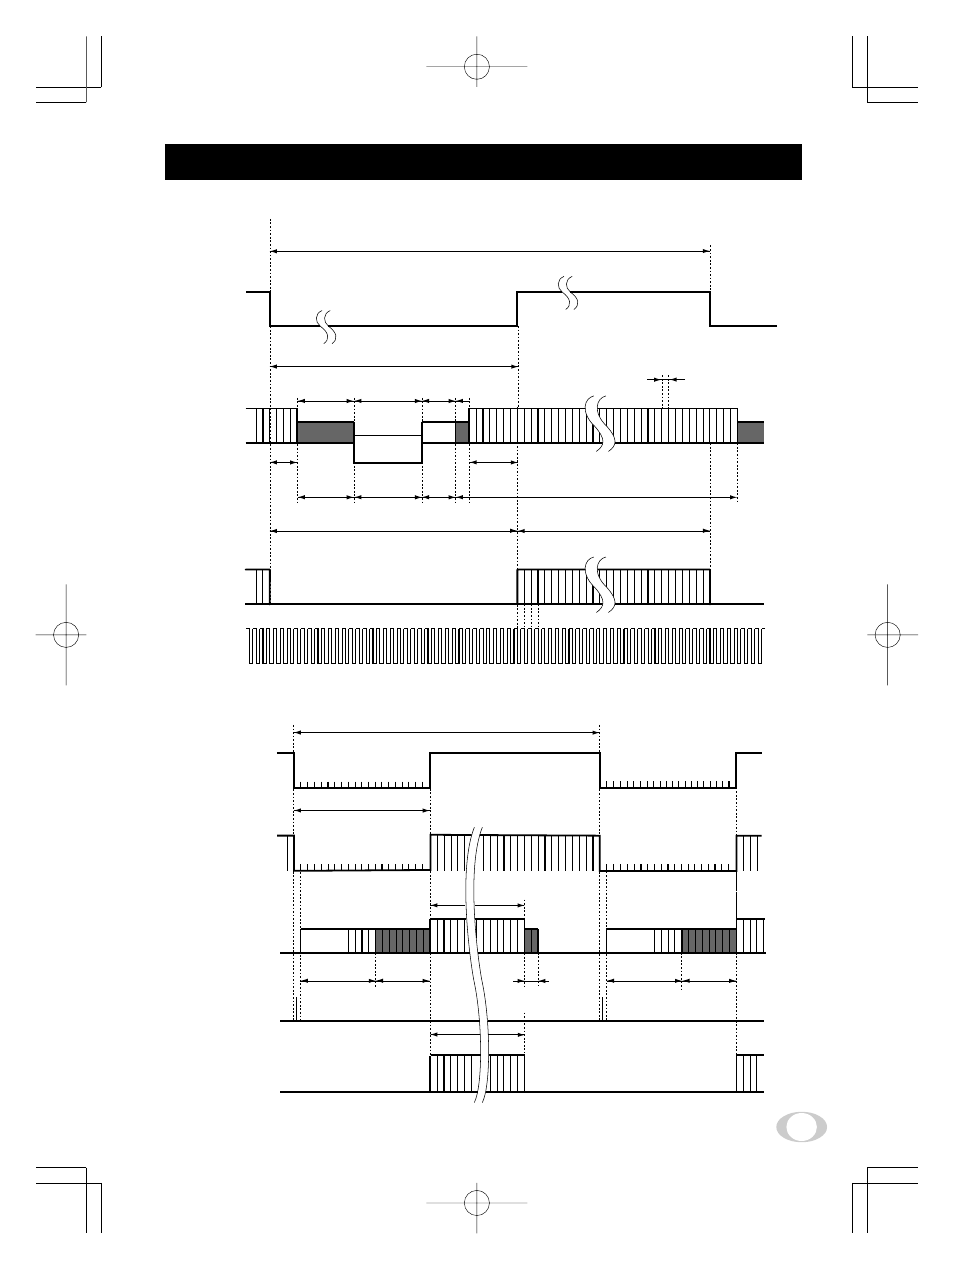
9. CCD OUTPUT WAVEFORM TIMING CHART
( 1 ) Horizontal Output Waveform Timing Chart
( 2 ) Vertical Output Waveform Timing Chart
132 clk
31 clk
72 clk
16 clk 2 clk
7 clk
40.7 ns
LVAL,
DVAL
CCD
output signal
Pixel
Clock
4
clk
Optical black
portion
Total effective pixels 659 clk
Horizontal blanking interval 132 clk
Optical black
portion
Horizontal transfer
stop interval
Dummy
pixels
(5.38
µ
s)
(5.38
µ
s)
Output video interval 648 clk
(26.4
µ
s)
One horizontal scan interval 780 clk
(31.8
µ
s)
CLK=40.74nsec
(24.5454MHz)
RGB data
1
2
493
494
525
1
2 3 4 5 1 2 3 4 5 6 7 8
1
2
1
2 3 4 5 1 2 3 4 5 6 7 8
496
525
20H
525H
(636
µ
s)
LVAL,
DVAL
FVAL
CCD
output signal
Dummy pixels Optical black
portion
Dumm
494H
y pixels Optical black
portion
Optical black
portion
Video output
RGB data
5
2
5
5
2
5
5
2
5
4
2
5
3
2
5
2
2
5
1
2
5
0
2
5
9
1
5
8
1
5
7
1
5
6
1
5
5
1
5
4
1
5
1
2
3
4
5
6
7
8
9
0
1
1
1
2
1
3
1
4
1
5
1
6
1
7
1
8
1
9
1
0
2
1
2
1
2
3
4
5
6
7 8
9
0
1
1
1
2
1
3
1
4
1
5
1
6
1
7
1
8
1
9
1
0
2
1
2