Lifescan UltraSmart User Manual
Page 118
109
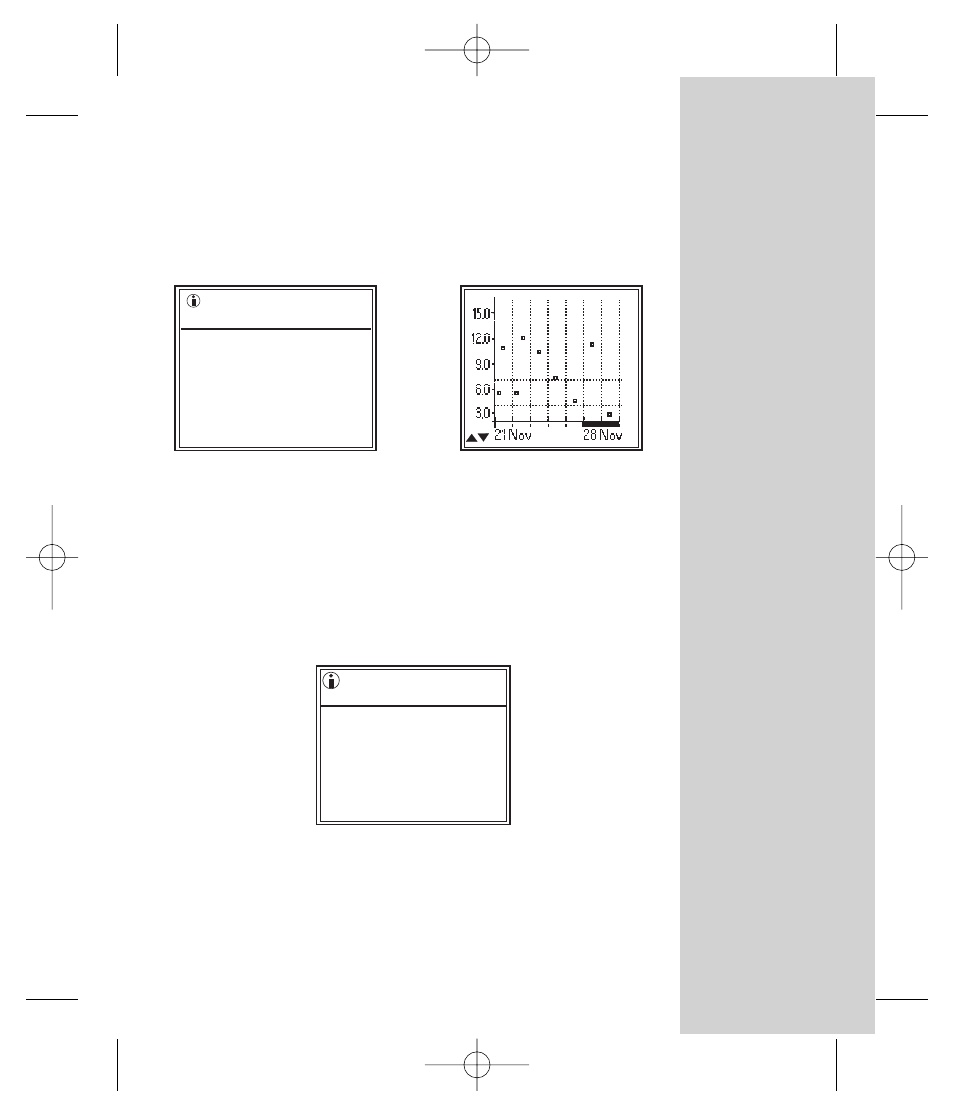
Results by time period are shown day by day, one
week at a time. Each time you reach the end of the
graph, it will move by one day. Weekends are noted by
a bold bar above the dates.
Average of All Results
Test result averages are available for the last 7, 14, 30,
60, and 90 days with the number of tests completed
during that time period included in parentheses.
Before Breakfast
Glucose Results
Graph daily results
by time period
Number of Days
Avg
7
14
30
60
90
6.7
8.2
10.4
11.1
11.2
(18)
(33)
(75)
(153)
(202)
Average of all
Results
DCO_06158108A_OUS_OB_GB 5/6/03 1:25 PM Page 109