Understanding the split zoom screen, Understanding the temp log screen – Garmin GPSMAP 2108 User Manual
Page 36
32
GPSMAP
®
2008/2108 Owner’s Manual
U
sing
s
onar
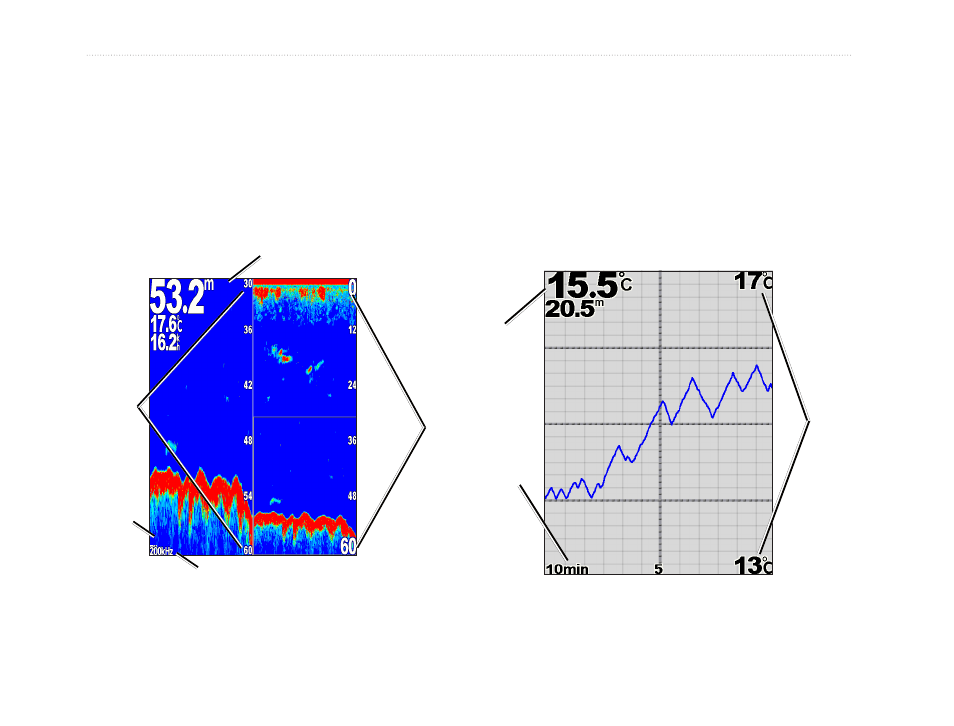
Understanding The Split Zoom
Screen
Use the Split Zoom screen to view the full sonar data
from the graph and a zoomed in portion on the same
screen.
From the Home screen, select
sonar
>
split Zoom
.
Transducer frequency
or beam width
Depth, temperature,
and speed
Range
Zoomed
depth scale
Zoom level
Understanding the Temp Log
Screen
If you are using a temperature-capable transducer, the
Temp Log screen keeps a graphic log of temperature
readings over time. The current temperature and depth
are shown in the top-left corner.
From the Home screen, select
sonar
>
Temp log
.
Temp
range
Time
elapsed
Temp
and
depth
The temperature appears along the right side and the
time elapsed appears along the bottom. The graph
scrolls to the left as information is received.