Changing the chart appearance – Garmin GPSMAP 2108 User Manual
Page 16
12
GPSMAP
®
2008/2108 Owner’s Manual
U
sing
C
harTs
heading line—draws an extension from the bow of
the boat in the direction of travel.
• Off—turn off the heading line.
• Distance—sets the distance to the end of the
heading line.
• Time—sets the amount of time until you reach
the end of the heading line.
Chart borders—turn on chart borders if you load
BlueChart
®
g2 maps and you want to see what areas
the maps cover.
Tracks—hide (off) or show (on) tracks on the chart.
Appearance—customize how items are shown on the
map.
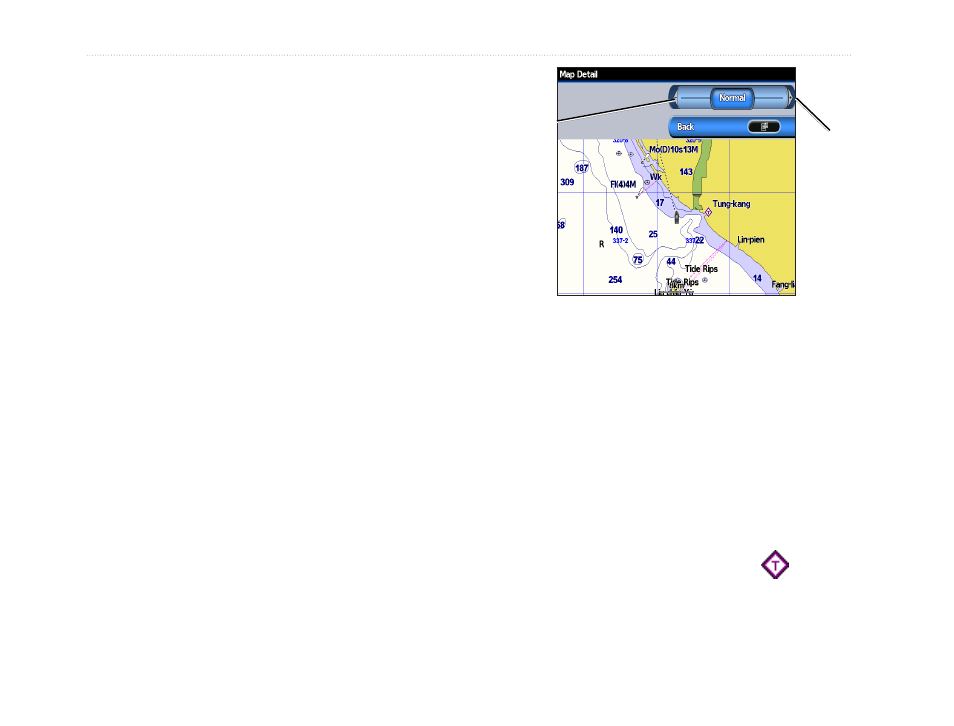
Changing the Chart Appearance
From the Home screen, select
Charts
>
Chart setup
>
Appearance
.
Detail—adjust the amount of detail shown on the
map.
Press right on
the
ROCKER
to
increase map
detail.
Press left on
the
ROCKER
to decrease
map detail.
spot Depths—turn on spot soundings and set a
dangerous depth.
light sectors—adjust the drawing of light sectors on
the map.
symbols—select the navaid symbol set (NOAA or
IALA).
Animate Tides —turn on a detailed icon that shows
the relevant tide level on the Navigation chart. If
Off, tide stations appear only as an icon (
) on the
Navigation chart.