Furuno FCV-1200LM User Manual
Page 59
3-11
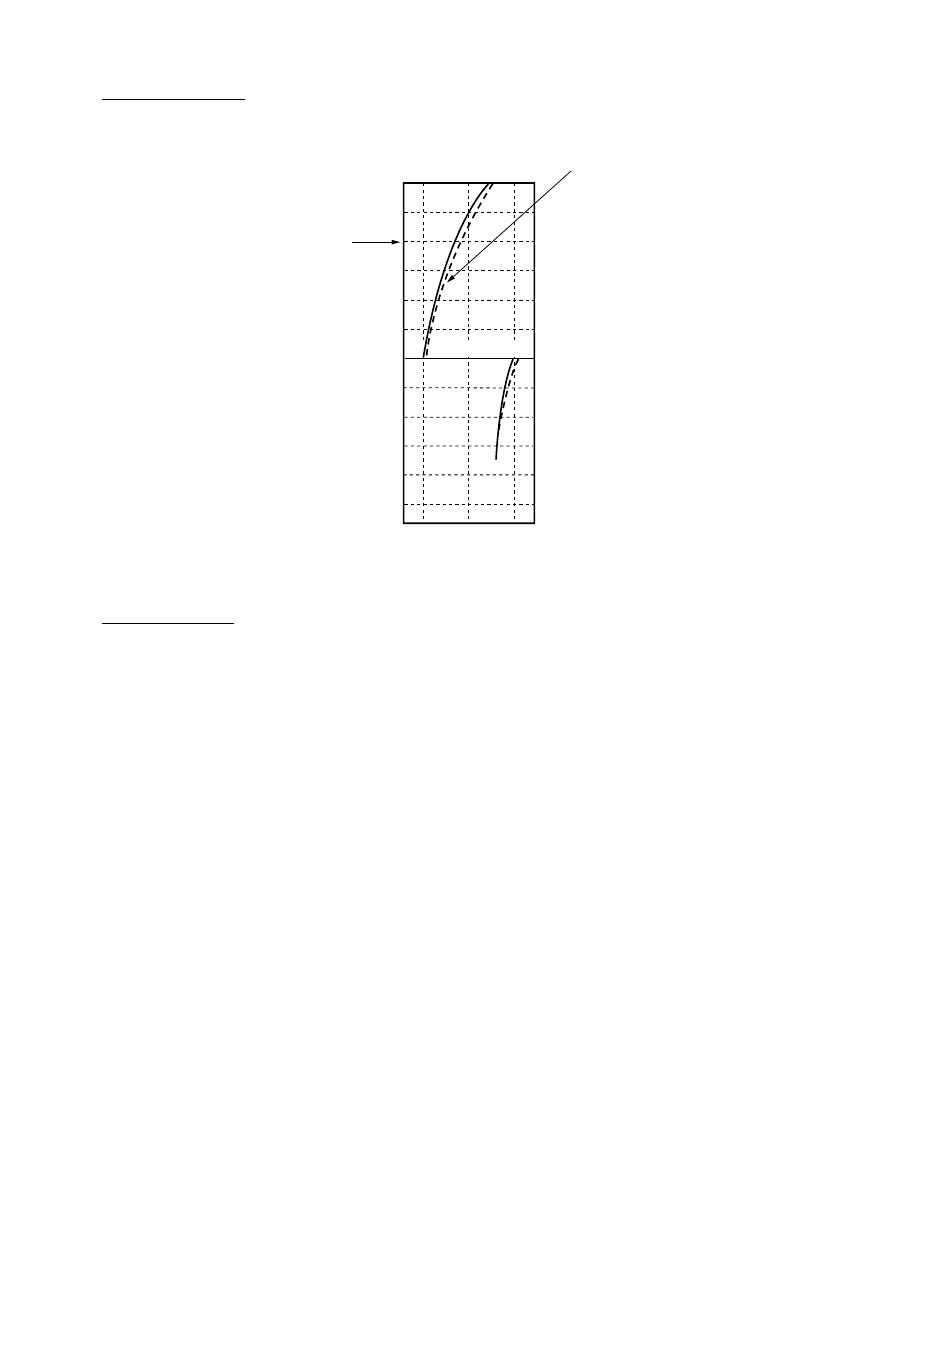
SONDE GRAPH
Turns on/off the net sonde water temperature graph.
Water temperature
graph
10
15
20
0
5
10
Horizontal lines
show depth.
Net sonde water temperature graph (at the left-hand side of display)
GRAPH MODE
Selects the display starting position of the net sonde water temperature graph. SURFACE is the
first-water temperature (surface condition); BOTTOM the last-written water temperature (net
sonde position). The display range is 12
°
C and scale interval is 5
°
C. For example, if the surface
water temperature is 18
°
C, the first temperature scale would be 10
°
C-20
°
C and the display
range is 9
°
C-21
°
C. If the water temperature drops by 9
°
C, for example, the next temperature
scale would be 0
°
C to 10
°
C and the display range –1
°
C to 11
°
C.
This manual is related to the following products: