Adding labels and axis markings – Apple Keynote 2 User Manual
Page 96
96
Chapter 6
Creating Charts
Adding Labels and Axis Markings
Use the Axis pane in the Chart Inspector to format the grid and general look of the
axes for bar charts, line charts, and area charts. You can set the range of values to be
displayed along the value axis, the axis on which you read the data point values. For
column charts (vertical bars), line charts, and area charts, the Y-axis is the value axis.
For horizontal bar charts, the X-axis is the value axis. (Pie charts don’t have a value
axis. To read about formatting pie charts, see “Pie Charts” on page 99.)
To show or hide axes and chart borders:
1
Select the chart.
2
In the Chart Inspector, click the Axis button if it is not already selected.
3
Choose one or more items in the Axes & Borders pop-up menu to select it.
A selected item has a checkmark next to it; choose the item again to deselect it.
To set the range of numerical values displayed on the chart grid:
1
Select the chart.
2
In the Chart Inspector, click the Axis button if it is not already selected.
3
To set the value at the chart origin, type a number in the Minimum field (under Value
Axis Format).
The Minimum value cannot be higher than the minimum value of your entire data set.
4
To set the highest number displayed on the value axis, type a number in the
Maximum field.
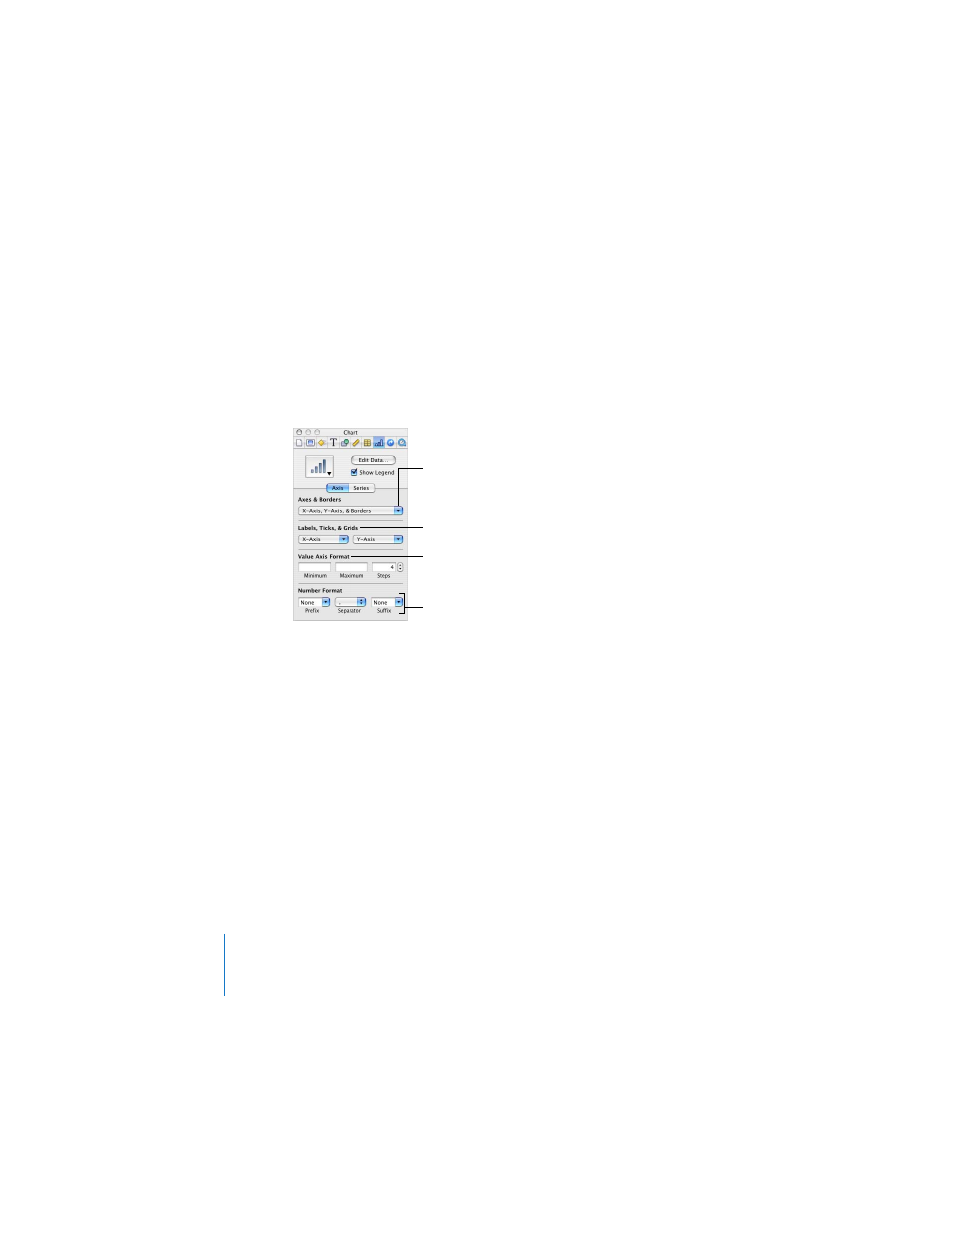
Show or hide chart borders
and axes.
Set the range of values
and the number of axis
markings on the chart grid.
Set styles for labels and
tick marks along the chart
grid.
Select units for values in
the chart.