Editing chart data – Apple Keynote 2 User Manual
Page 93
Chapter 6
Creating Charts
93
Editing Chart Data
To edit chart data, open the Chart Data Editor and enter your data by typing it or
copying and pasting from Excel, AppleWorks, or other spreadsheet applications.
To open the Chart Data Editor:
1
Select a chart on a slide.
2
Choose Format > Chart > Show Data Editor (or click Edit Data in the Chart Inspector).
To copy data from another spreadsheet into the Chart Data Editor:
1
Open the spreadsheet and select cells you want to copy.
2
Choose Edit > Copy (or press Command-C).
3
Select the top cell in the first column of the Chart Data Editor.
4
Choose Edit > Paste (or press Command-V).
To edit the names of rows and columns, or the data in a cell:
m
Double-click a cell or a row or column label and type.
To reorder rows or columns in the Chart Data Editor:
m
Drag a row or column label to a new position.
To add rows or columns in the Chart Data Editor, do one of the following:
 Click Add Row or Add Column to place a row above the selected row or a column to
the left of the selected column. If no row or column is selected, the new row or
column appears at the bottom or right edge of the table. (To see the new row or
column, you may have to press the Return or Tab key or expand the Chart Data
Editor window.)
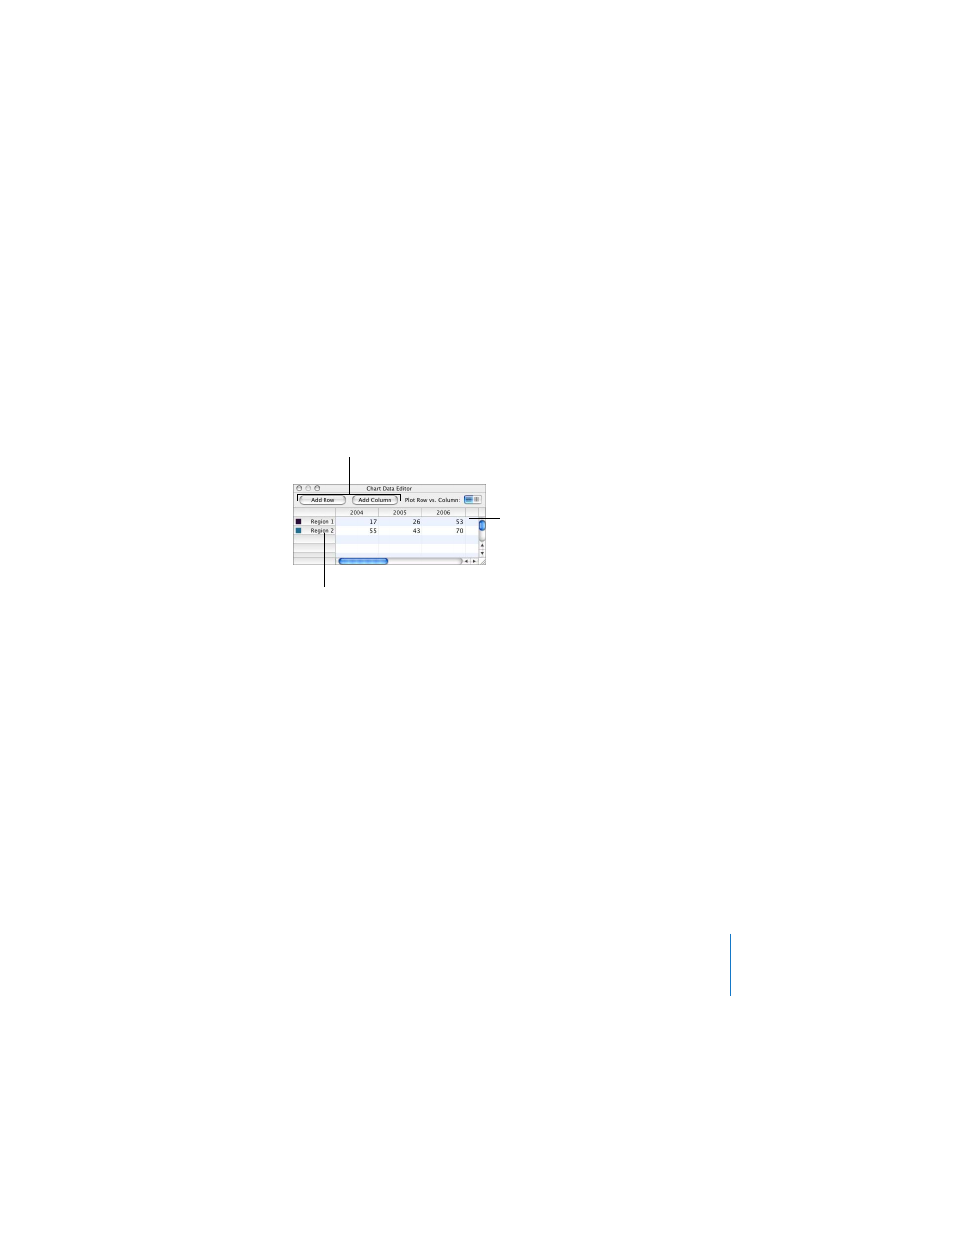
Type chart data directly
into these spreadsheet
cells.
Click these buttons to add
another row or column for
data.
Drag labels to reorder them.