HP PROLIANT BL465C G7 User Manual
Page 13
13
Canary times
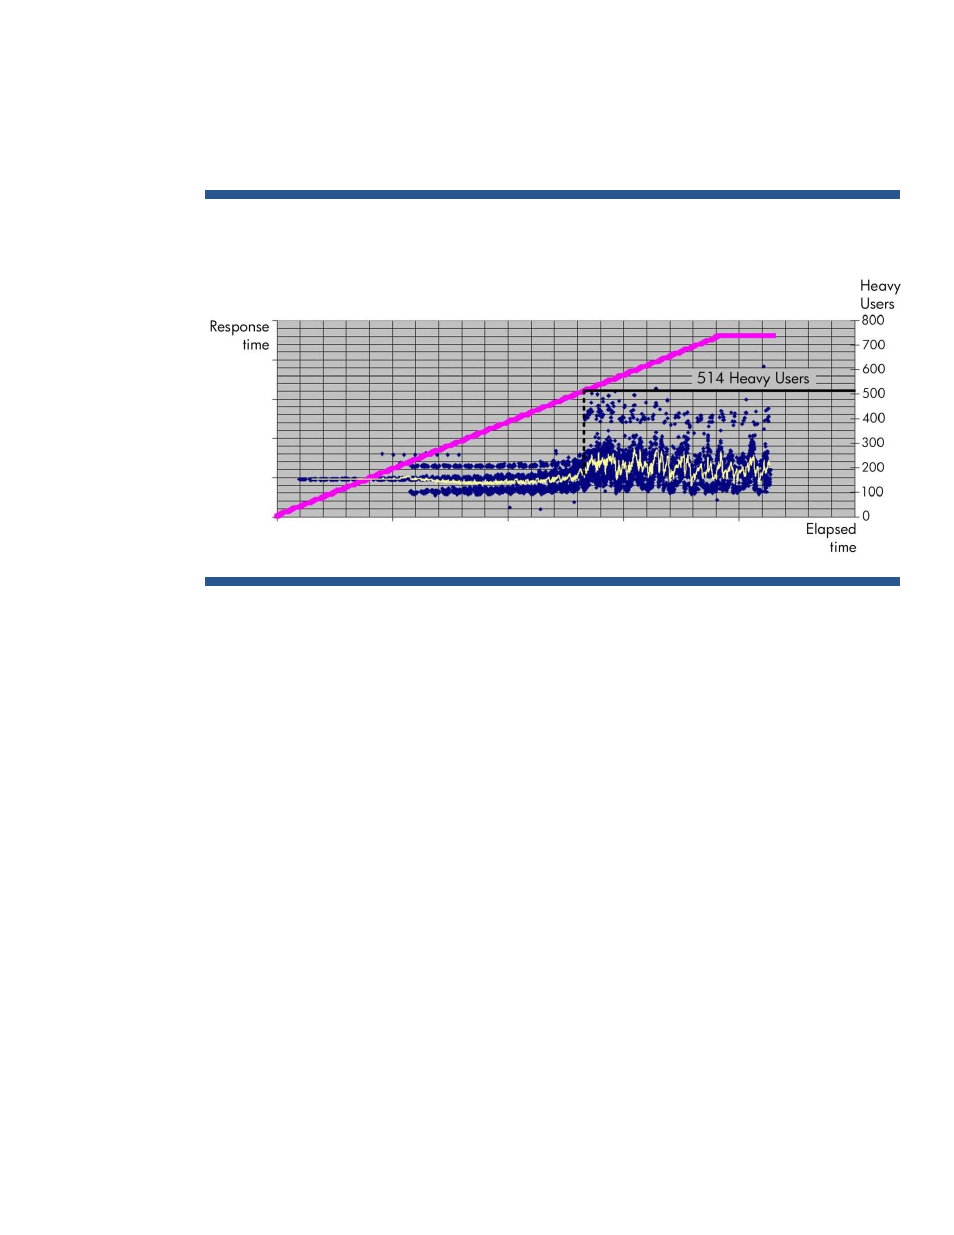
Figure 5 shows sample results for the tested server when running a typical canary script. Individual
user response times are shown in blue, with a yellow line depicting average response times.
HP analyzed this figure to determine when response times began to increase markedly and
consistently over a baseline level, indicating that user response times had become unacceptable.
Figure 5. Canary time values show that user response times started to become unacceptable when 514 Heavy Users were
active
Figure 5 indicates that response times were acceptable when 487 Heavy Users – the optimal number
– were active.
However, more users were able to log on up to a maximum of 739, limited by lack of CPU resources.
32-bit test environment
HP ran a performance test using a workload based on the Heavy User profile. Figure 6 shows select
Perfmon values during this test run.
- UX B6941-90001 (548 pages)
- A3661B (95 pages)
- C100/110 (252 pages)
- L1702 (45 pages)
- 576X-B (1 page)
- rx5670 (13 pages)
- ProLiant PC2-6400 (38 pages)
- PC (120 pages)
- S3240 (2 pages)
- LC 2000R (194 pages)
- GS80 (41 pages)
- COMPAQ DX2710 MT (107 pages)
- TOUCHSMART 9100 (62 pages)
- BC1500 (13 pages)
- Proliant DL580 (48 pages)
- Proliant DL580 (53 pages)
- DX2200 (31 pages)
- ProLiant Server Blade BL460c (31 pages)
- P6000 (105 pages)
- d530 Series (2 pages)
- dc5700 (216 pages)
- RX7620-16 (43 pages)
- ProLiant ML370 G5 (46 pages)
- PROLIANT ML350 G6 (54 pages)
- BL35P (22 pages)
- COMPAQ DC5750 (214 pages)
- Agent-Desktop-Laptop Computer (23 pages)
- DL380 G7 (126 pages)
- xw8600 (73 pages)
- Pavilion A6140 (2 pages)
- Z800 (55 pages)
- 8080 ELITE BUSINESS (284 pages)
- VECTRA VL800 (72 pages)
- Vectra XE320 (82 pages)
- Vectra XE320 (32 pages)
- AA-RTDRB-TE (146 pages)
- BL465C (66 pages)
- DM4 (113 pages)
- PROLIANT 580554-001 (87 pages)
- ProLiant ML330 (34 pages)
- ProLiant ML330 (44 pages)
- LH 3r (23 pages)
- Compaq dc7900 (3 pages)
- T5000 (41 pages)