Retrotec DM32 Data Logger User Manual
Page 27
Page 27 of 27
©Retrotec Inc. 2014
13. Push the Select Range button to return to the main Edit Series window.
14. Click the “OK” in the Edit Series window button to finish graphing the data set for Channel A of
the first gauge.
15. Repeat Steps #6 to #14 for the remaining data sets (three more for this example: Channel B for
the first gauge, Channel A for the second gauge, and Channel B for the second gage.
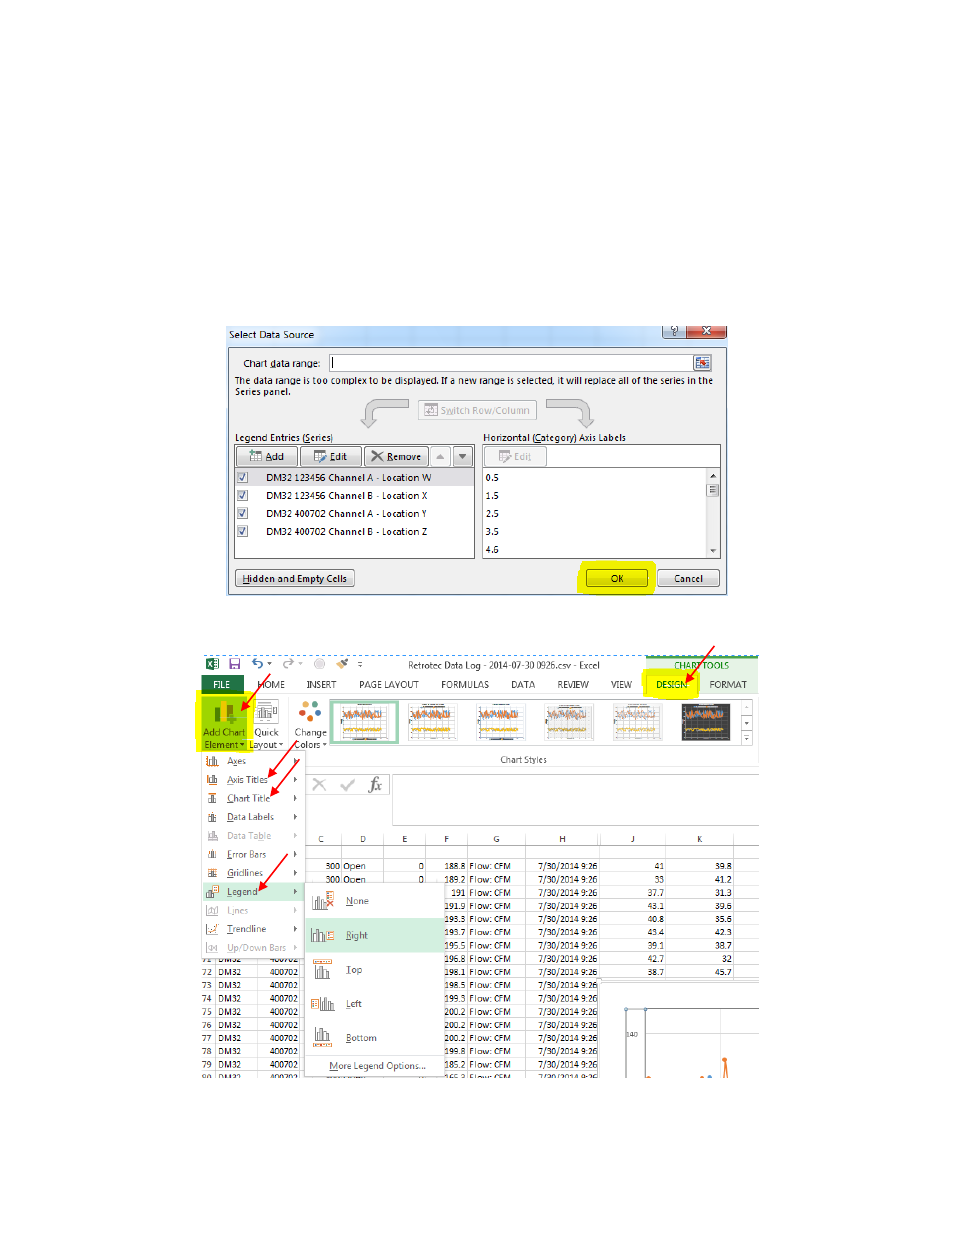
16. You will now see the four data sets on the left panel of the Select Data Source window. Click the
“OK” button to graph these data sets.
17. Click the “DESIGN” tab under Chart Tools, click the “Add Chart Element” button, then add a
Legend, Chart Title, Axis Titles, to your graph.
18. Modify additional elements of the graph further, to your own preferences.