Retrotec DM32 Data Logger User Manual
Page 25

Page 25 of 27
©Retrotec Inc. 2014
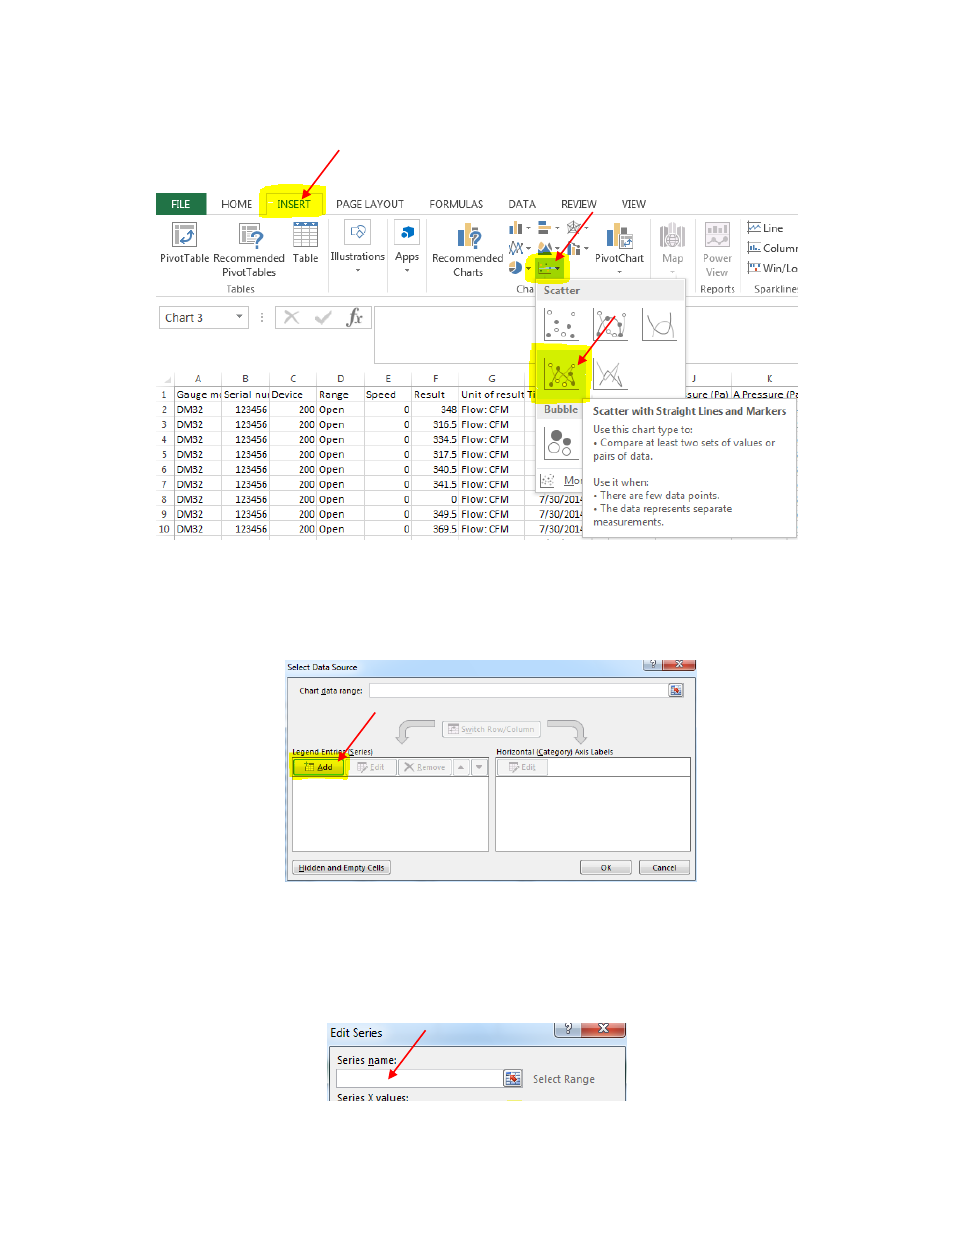
4. Click the “INSERT” tab and the graph type you want under its “Charts” section. Excel offers
many types for your preference, but for this example, select “Scatter plot with Straight Lines
and Markers”.
At this point, a graph is automatically generated in the spreadsheet, but does not contain the four
desired data sets yet.
5. Right click inside the graph and click “Select Data”. The “Select Data Source” window will display
6. Click the “Add” button.
7. In the Edit Series window, under the “Series name” field, type in a unique identifier for your
data set name. For example, this can include details of your gauge serial number, Channel name,
and location of tube. For example, “DM32 123456 Channel A – Location X”.
