Graphing pressure data from multiple gauges – Retrotec DM32 Data Logger User Manual
Page 23
Page 23 of 27
©Retrotec Inc. 2014
12. Graphing pressure data from multiple gauges
Data logger software exports Retrotec gauge measurements and results to a Microsoft Excel®
spreadsheet. Excel is a very useful application that allows the flexibility of organizing and graphing
data to a preferred view for analysis.
The following instruction is only an example of one suggested method to sort and graph your data,
but there are infinitely other methods that will suit your preferences. The instructions and
illustrations below may differ if you are using a version other than Microsoft Excel 2013.
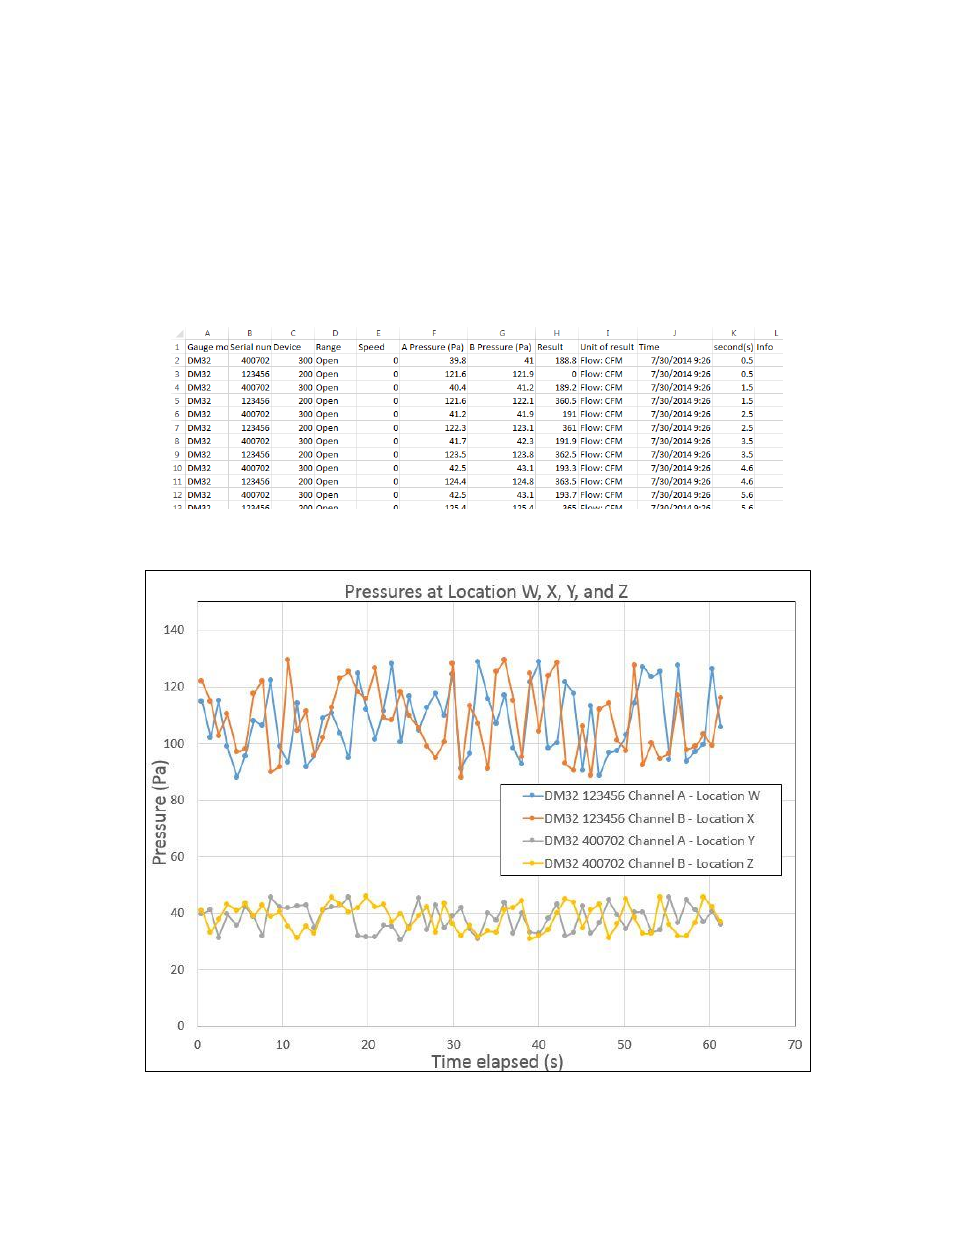
For example, you begin with Data Logger results from two gauges, exported and saved to Excel:
You may want to graphically analyze Channel A and Channel B pressures of both these gauges, similar to
the following: