Graphing chapter 4 – Casio fx-7400G PLUS Graphing User Manual
Page 25
71
Graphing
Chapter 4
In the RUN or PRGM Mode
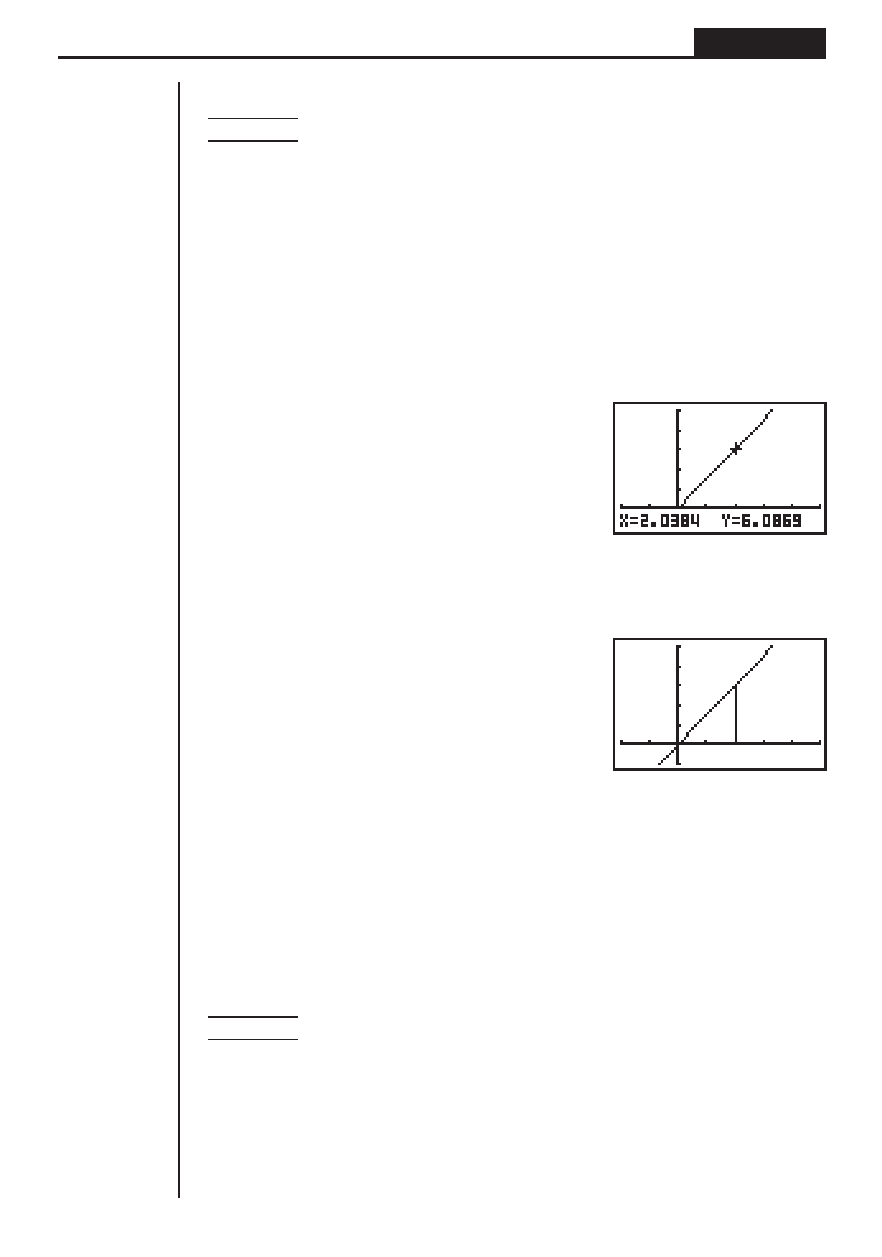
Example
To draw a line perpendicular to the
x
-axis from point (
x
,
y
) = (2, 6)
on the graph
y
= 3
x
Use the following View Window parameters:
Xmin
= –2
Ymin
= –2
Xmax = 5
Ymax = 10
Xscl
= 1
Yscl
=
2
1. After drawing the graph, use the procedure under “To plot points” to move the
pointer to (
x
,
y
) = (2, 0), then use the cursor key (
f) to move the pointer on the
graph
y
= 3
x
.
u
!4(SKTCH)3(PLOT)1(Plot)
c,a
wwf~f
2. Display the sketch menu and perform the following operation to draw a straight
line between the two points.
u
!4(SKTCH)4(LINE)1(Line)w
• The above draws a straight line between the current pointer location and the
previous pointer location.
u
uu
u
uTo draw vertical and horizontal lines
The procedures presented here draw vertical and horizontal lines that pass through
a specific coordinate.
In the STAT, GRAPH or TABLE Mode
Example
To draw a vertical line on the graph of
y
=
x
(
x
+ 2)(
x
– 2)
1. After graphing the function, display the sketch menu and perform the following
operation to display the pointer and draw a vertical line through its current loca-
tion.
!4(SKTCH)[1(Vert)