Chapter 4 graphing – Casio fx-7400G PLUS Graphing User Manual
Page 18
64
Chapter 4
Graphing
Use the following View Window parameters.
Xmin
= –8
Ymin
= –30
Xmax = 8
Ymax = 30
Xscl
= 5
Yscl
= 10
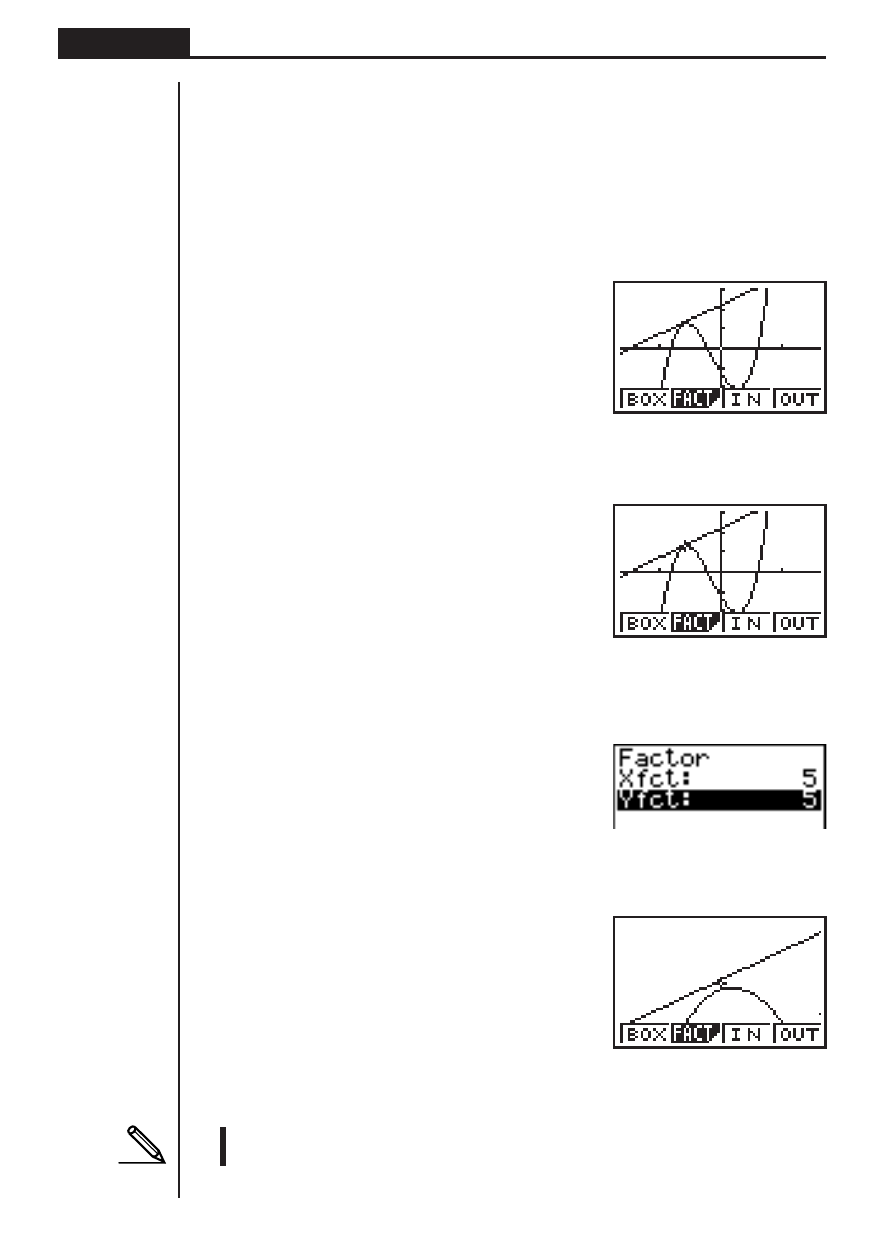
1. After graphing the functions, press !2 (ZOOM), and the pointer appears on
the screen.
!2(ZOOM)
2. Use the cursor keys (
d, e, f, c) to move the pointer to the location that
you want to be the center of the new display.
d
~
d f
~
f
3. Press 2 (FACT) to display the factor specification screen, and input the factor
for the
x
- and
y
-axes.
2(FACT)
f
wfw
4. Press Q to return to the graphs, and then press 3 (IN) to enlarge them.
Q3(IN)
This enlarged screen makes it clear that the graphs of the two expressions are not
tangential.
• Note that the above procedure can also be used to reduce the size of a graph
(zoom out). In step 4, press 4 (OUT).
1
2
3
4
This manual is related to the following products: