Graphing chapter 4, Kk sketch function – Casio fx-7400G PLUS Graphing User Manual
Page 19
65
Graphing
Chapter 4
1
2
3
4
[
1
2
3
4
[
1
2
3
4
[
• The above procedure automatically converts the
x
-range and
y
-range View Win-
dow values to 1/5 of their original settings.
• You can repeat the factor zoom procedure more than once to further enlarge or
reduce the graph.
u
uu
u
uTo initialize the zoom factor
Press ! 2 (ZOOM) 2 (FACT) 1 (INIT) to initialize the zoom factor to the
following settings.
Xfct = 2 Yfct = 2
• You can use the following syntax to incorporate a factor zoom operation into a
program.
Factor
• You can use factor zoom for any type of graph.
k
k
k
k
k Sketch Function
The sketch function lets you draw lines and graphs on an existing graph.
• Note that Sketch function operation in the STAT, GRAPH or TABLE Mode is
different from Sketch function operation in the RUN or PRGM Mode.
u
uu
u
uBefore using the Sketch Function
Press ! 4 (SKTCH) to display the sketch menu.
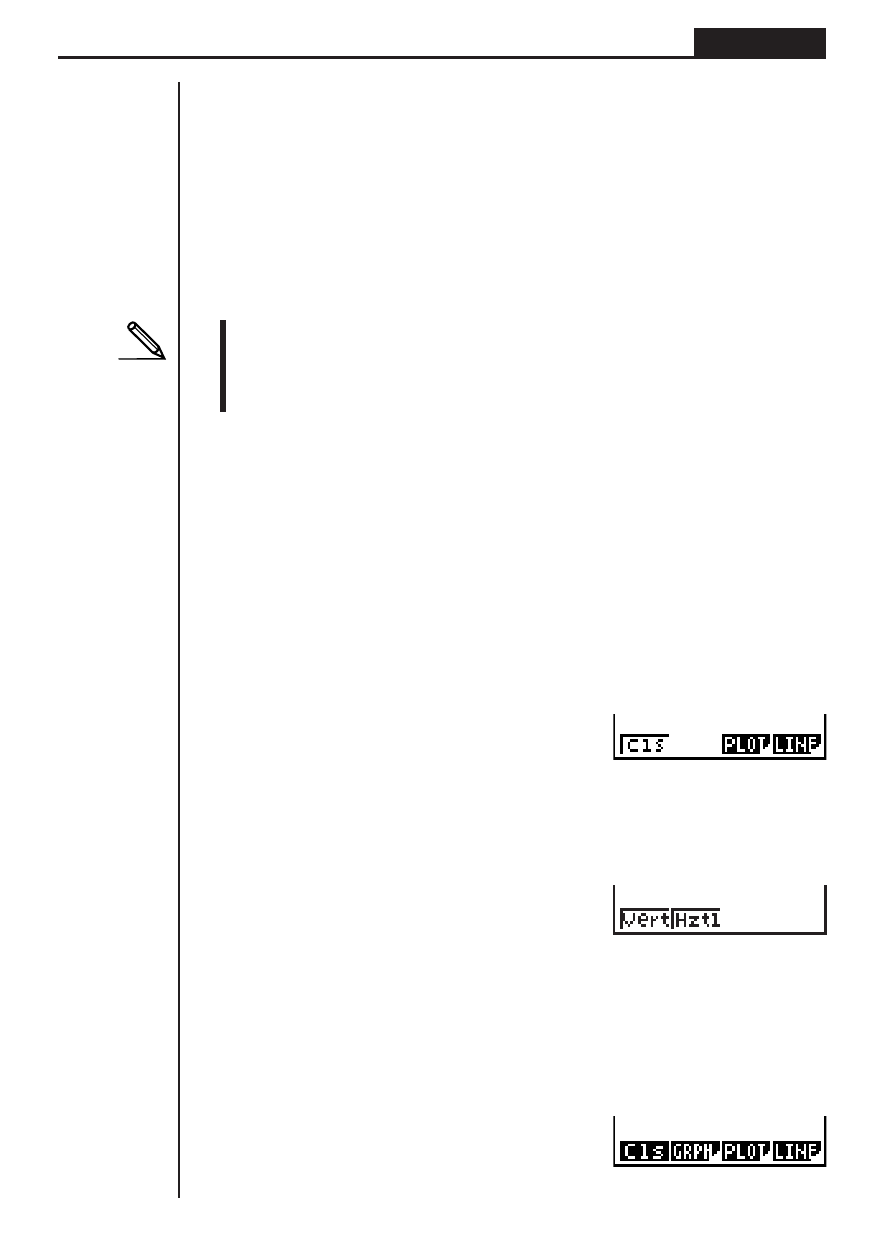
In the STAT, GRAPH or TABLE Mode
!4(SKTCH)
1 (Cls) .......... Clears drawn line and point
3 (PLOT) ...... Displays plot menu
4 (LINE) ....... Displays line menu
[
1 (Vert) ........ Vertical line
2 (Hztl) ......... Horizontal line
Press [ to return to the previous menu
In the RUN or PRGM Mode
!4(SKTCH)