Graphing chapter 4 – Casio fx-7400G PLUS Graphing User Manual
Page 15
61
Graphing
Chapter 4
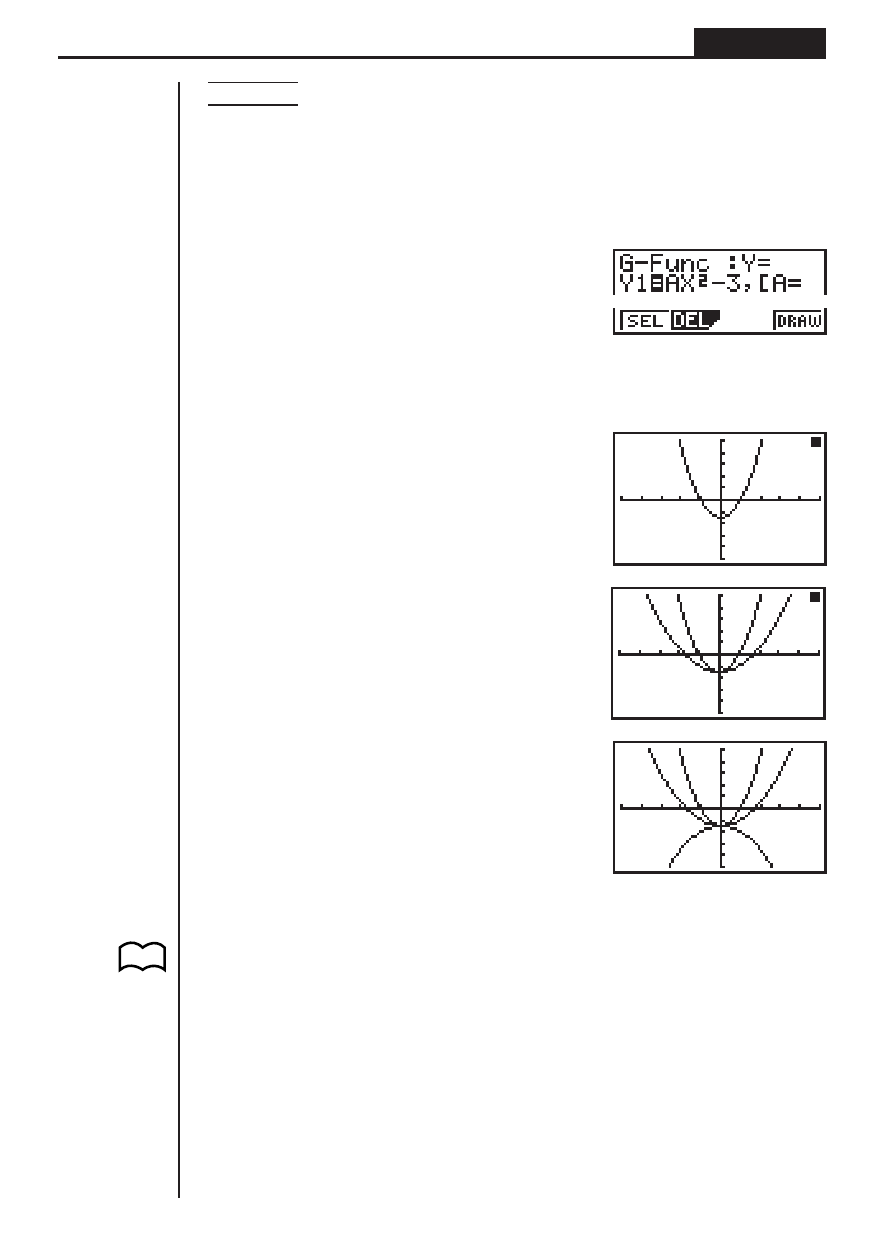
Example
To graph
y
= A
x
2
– 3, substituting 3, 1, and –1 for the value of A
Use the following View Window parameters.
Xmin
= –5
Ymin
= –10
Xmax = 5
Ymax = 10
Xscl
= 1
Yscl
=
2
[1(Y =)
(Specifies graph type.)
aATx-d,
![aA!=d,
b,
-b!]w
(Stores expression.)
4(DRAW) or w
(Draws graph.)
↓
↓
• The function that is input using the above syntax can have only one variable.
• You cannot use X, Y or T as the variable name.
• You cannot assign a variable to the variable in the function.
• When the set-up screen’s Simul-G item is set to “On,” the graphs for all the vari-
ables are drawn simultaneously.
1
2
3
4
P.8
This manual is related to the following products:
See also other documents in the category Casio Calculators, organizers:
- fx-115ES (75 pages)
- fx-115ES (54 pages)
- FX-9750GII (402 pages)
- FX-9750GII (17 pages)
- FX-9750GII (411 pages)
- FX-300MS (2 pages)
- FX-300MS (9 pages)
- DJ-120TG (67 pages)
- FX-9860G AU E (6 pages)
- FX-9860G AU E (9 pages)
- FX-CG20 (601 pages)
- FX-CG20 (18 pages)
- fx-FD10 Pro (601 pages)
- MJ-120D (75 pages)
- fx-115MS (46 pages)
- fx-115MS (39 pages)
- FX-82SOLAR (38 pages)
- fx-9750G Dual Graph (8 pages)
- fx-7400G Programming (486 pages)
- fx-9750G PLUS Getting Acquainted (39 pages)
- fx-570ES PLUS (46 pages)
- fx-991ZA PLUS (59 pages)
- fx-350TL (36 pages)
- CFX-9950GB PLUS (28 pages)
- CFX-9850GB PLUS (19 pages)
- ALGEBRA FX 1.0 PLUS Programming (603 pages)
- ALGEBRA FX2.0 Advanced Statistics INTR (596 pages)
- ALGEBRA FX2.0 Advanced Statistics DIST (67 pages)
- TE-100 (88 pages)
- 9860 (5 pages)
- EMULATOR FX-ES (18 pages)
- fx-7400G Getting Acquainted (12 pages)
- FX-912MS (19 pages)
- s-v.p.a.m. fx-300MS (40 pages)
- fx-5800P (147 pages)
- SF-4900ER (118 pages)
- FX-991WA (38 pages)
- SF-7200SY (83 pages)
- ClassPad 300 Spreadsheet Application (954 pages)
- ClassPad 300 Spreadsheet Application (965 pages)
- ClassPad 300 Spreadsheet Application (753 pages)
- ClassPad 300 PLUS (18 pages)
- ClassPad 330 V.3.03 (670 pages)
- fx-570W (43 pages)
- fx-3950P (61 pages)