Graphing chapter 4 – Casio fx-7400G PLUS Graphing User Manual
Page 11
57
Graphing
Chapter 4
u
uu
u
uTo graph parametric functions
You can graph parametric functions that can be expressed in the following format.
(X, Y) = (
f
(T),
g
(T))
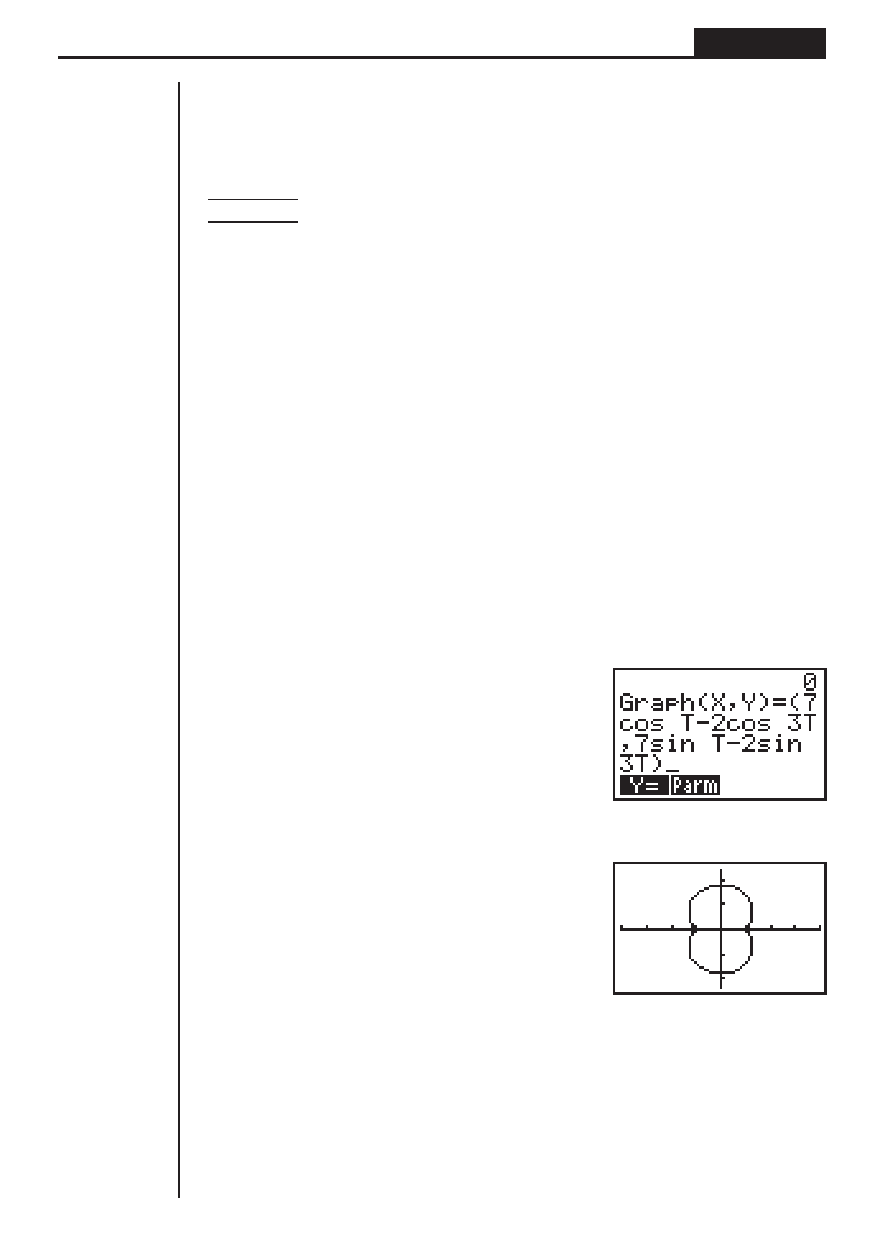
Example
To graph the following parametric functions:
x
= 7 cos T – 2 cos 3T
y
= 7 sin T – 2 sin 3T
Use the following View Window parameters.
Xmin
= –20
Ymin
= –12
Xmax
=
20
Ymax
=
12
Xscl
=
5
Yscl
=
5
Tmin
=
0
Tmax
=
2
π
Tptch
=
π÷36
1. In the set-up screen, specify the appropriate graph type for F-Type.
!Z2(Parm)
2. Set the default angle unit to radians (Rad).
cc2(Rad)Q
3. Input the parametric functions.
A!4(SKTCH)1(Cls)w
2(GRPH)2(Parm)
h
cT-ccdT,
h
sT-csdT)
4. Press w to draw the graph.
w
u
uu
u
uTo graph inequalities
You can graph inequalities that can be expressed in the following four formats.
•
y
>
f
(
x
)
•
y
<
f
(
x
)
•
y
>
f
(
x
)
•
y
<
f
(
x
)