Casio ALGEBRA FX 2.0 PLUS Graphing User Manual
Page 85
19990401
○ ○ ○ ○ ○
Example
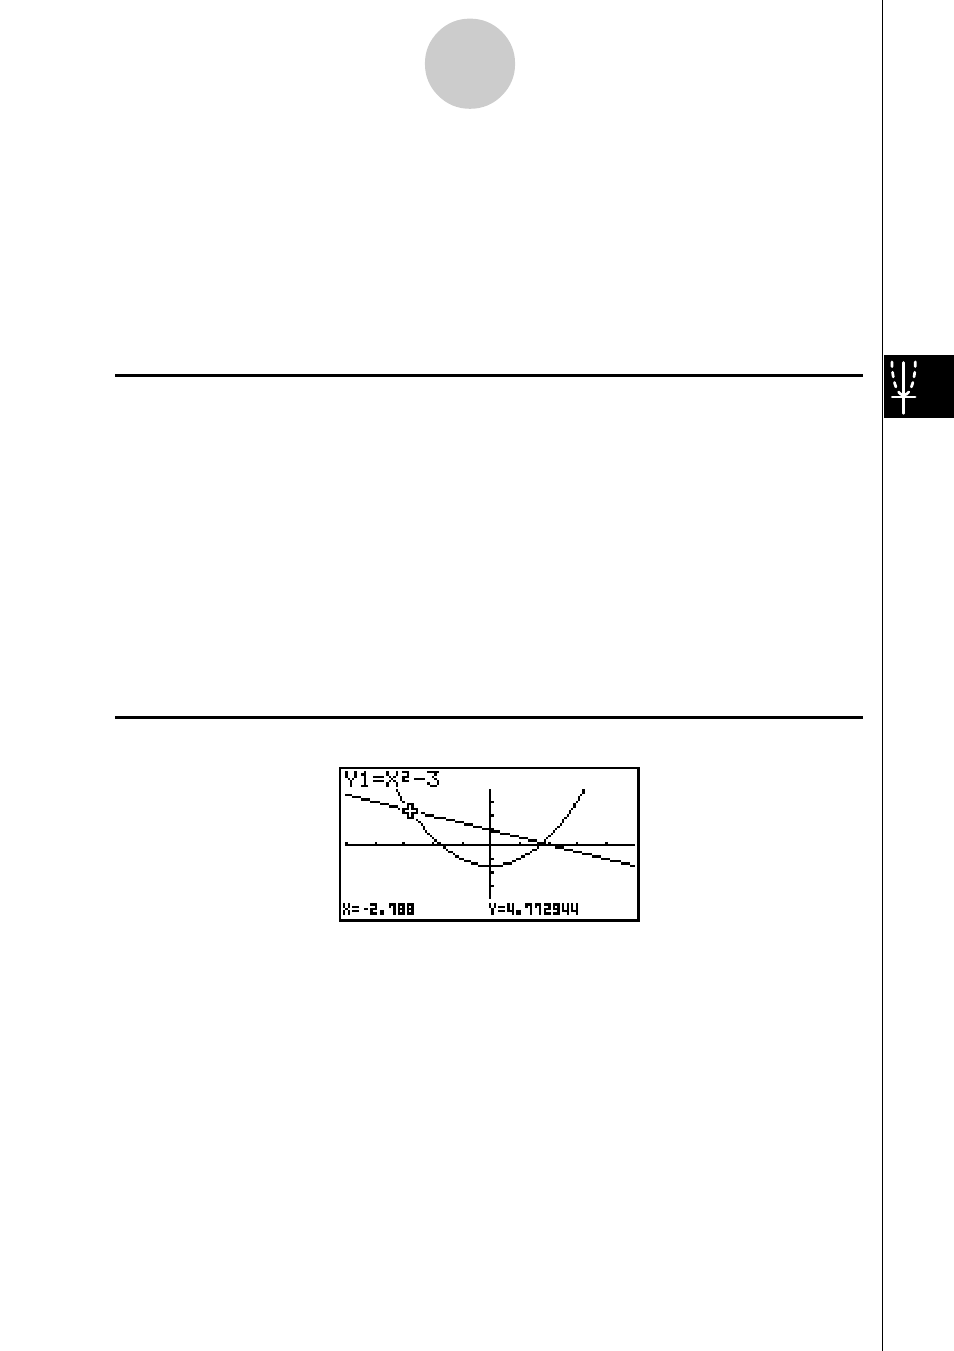
Use coordinate rounding and display the coordinates in the vicinity of
the points of intersection for the two graphs produced by the
functions shown below.
Y1 =
x
2
– 3, Y2 = –
x
+ 2
Use the following V-Window settings.
Xmin = –5,
Xmax = 5,
Xscale = 1
Ymin = –10,
Ymax = 10,
Yscale = 2
Procedure
1
m GRPH
•
TBL
!K(V-Window) -fwfwbwc
-bawbawcwi
3(TYPE)b(Y=)vx-dw
-v+cw
5(DRAW)
2
2(ZOOM)i(Rnd)
3
1(TRACE)
d~d
Result Screen
5-11-8
Function Analysis
This manual is related to the following products:
See also other documents in the category Casio Calculators, organizers:
- fx-115ES (75 pages)
- fx-115ES (54 pages)
- FX-9750GII (402 pages)
- FX-9750GII (17 pages)
- FX-9750GII (411 pages)
- FX-300MS (2 pages)
- FX-300MS (9 pages)
- DJ-120TG (67 pages)
- FX-9860G AU E (6 pages)
- FX-9860G AU E (9 pages)
- FX-CG20 (601 pages)
- FX-CG20 (18 pages)
- fx-FD10 Pro (601 pages)
- MJ-120D (75 pages)
- fx-115MS (46 pages)
- fx-115MS (39 pages)
- FX-82SOLAR (38 pages)
- fx-9750G Dual Graph (8 pages)
- fx-7400G Programming (486 pages)
- fx-9750G PLUS Getting Acquainted (39 pages)
- fx-570ES PLUS (46 pages)
- fx-991ZA PLUS (59 pages)
- fx-350TL (36 pages)
- CFX-9950GB PLUS (28 pages)
- CFX-9850GB PLUS (19 pages)
- ALGEBRA FX 1.0 PLUS Programming (603 pages)
- ALGEBRA FX2.0 Advanced Statistics INTR (596 pages)
- ALGEBRA FX2.0 Advanced Statistics DIST (67 pages)
- TE-100 (88 pages)
- 9860 (5 pages)
- EMULATOR FX-ES (18 pages)
- fx-7400G Getting Acquainted (12 pages)
- FX-912MS (19 pages)
- s-v.p.a.m. fx-300MS (40 pages)
- fx-5800P (147 pages)
- SF-4900ER (118 pages)
- FX-991WA (38 pages)
- SF-7200SY (83 pages)
- ClassPad 300 Spreadsheet Application (954 pages)
- ClassPad 300 Spreadsheet Application (965 pages)
- ClassPad 300 Spreadsheet Application (753 pages)
- ClassPad 300 PLUS (18 pages)
- ClassPad 330 V.3.03 (670 pages)
- fx-570W (43 pages)
- fx-3950P (61 pages)