Casio ALGEBRA FX 2.0 PLUS Graphing User Manual
Page 67
19990401
○ ○ ○ ○ ○
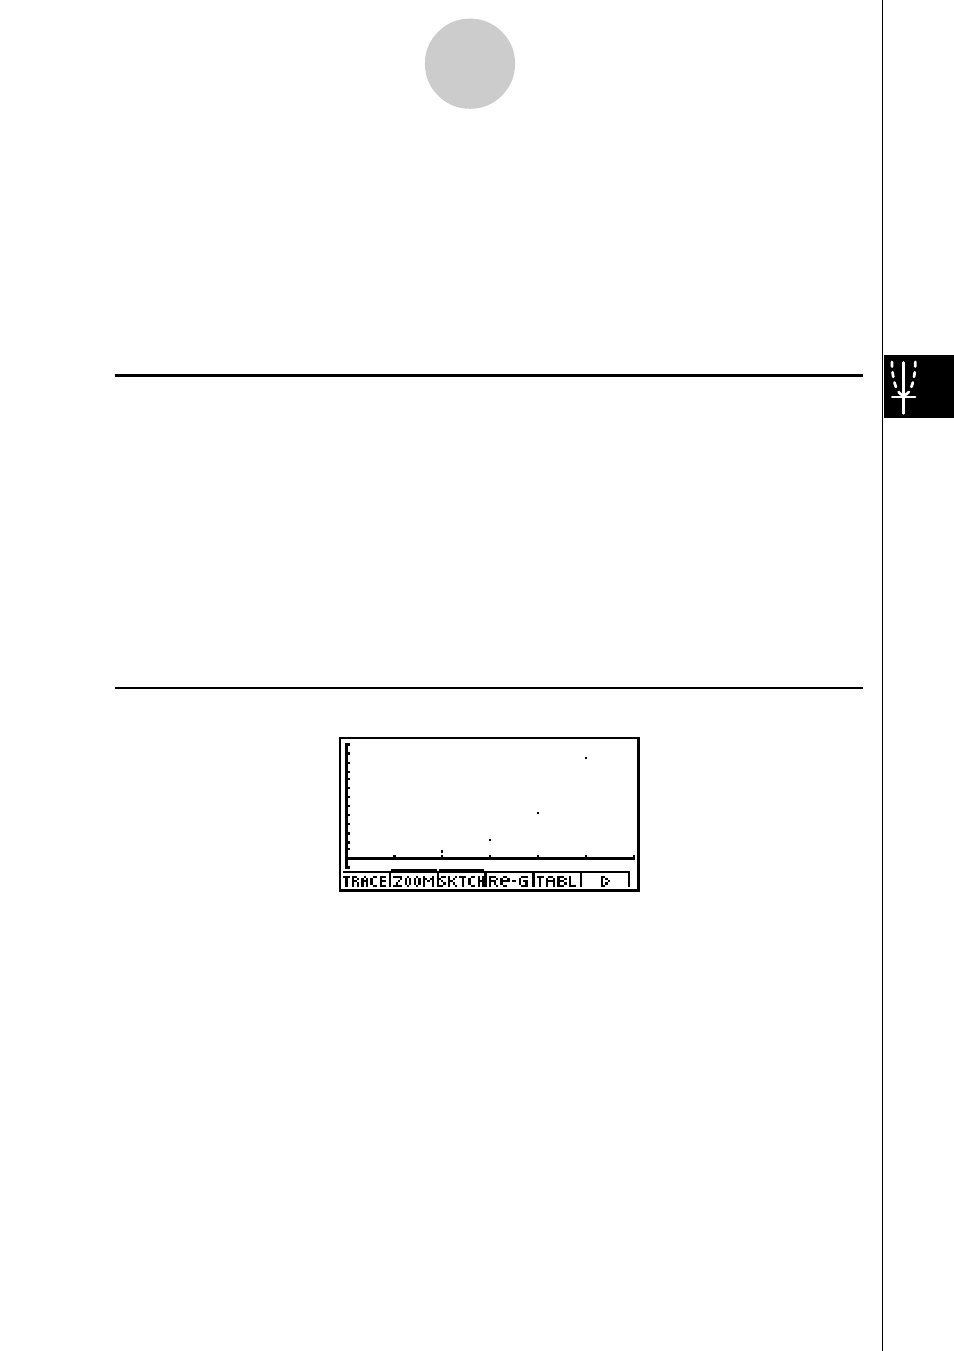
Example
Generate a number table from recursion between two terms as
expressed by
a
n
+
1
= 2
a
n
+1, with an initial term of
a
1
= 1, as
n
changes
in value from 1 to 6. Use the table values to draw a plot line graph with
ordinate
Σ
a
n
, abscissa
n
.
Use the following V-Window settings.
Xmin = 0,
Xmax = 6,
Xscale = 1
Ymin = –15,
Ymax = 65,
Yscale = 5
Procedure
1
m RECUR
2
u3(SET UP)1(On)i
3
!K(V-Window) awgwbwc
-bfwgfwfwi
4
3(TYPE)c(
a
n
+
1
=)c2(
a
n
)+bw
5
5(RANG)2(
a
1
)bwgwbwi
6
6(TABL)
7
6(G
•
PLT)c(
Σa
n
)
Result Screen
5-9-6
Graphing a Recursion Formula
This manual is related to the following products:
See also other documents in the category Casio Calculators, organizers:
- fx-115ES (75 pages)
- fx-115ES (54 pages)
- FX-9750GII (402 pages)
- FX-9750GII (17 pages)
- FX-9750GII (411 pages)
- FX-300MS (2 pages)
- FX-300MS (9 pages)
- DJ-120TG (67 pages)
- FX-9860G AU E (9 pages)
- FX-9860G AU E (6 pages)
- FX-CG20 (18 pages)
- fx-FD10 Pro (601 pages)
- FX-CG20 (601 pages)
- MJ-120D (75 pages)
- fx-115MS (46 pages)
- fx-115MS (39 pages)
- FX-82SOLAR (38 pages)
- fx-9750G PLUS Getting Acquainted (39 pages)
- fx-9750G Dual Graph (8 pages)
- fx-7400G Programming (486 pages)
- fx-570ES PLUS (46 pages)
- fx-991ZA PLUS (59 pages)
- fx-350TL (36 pages)
- CFX-9950GB PLUS (28 pages)
- CFX-9850GB PLUS (19 pages)
- ALGEBRA FX 1.0 PLUS Programming (603 pages)
- ALGEBRA FX2.0 Advanced Statistics INTR (596 pages)
- ALGEBRA FX2.0 Advanced Statistics DIST (67 pages)
- TE-100 (88 pages)
- 9860 (5 pages)
- EMULATOR FX-ES (18 pages)
- fx-7400G Getting Acquainted (12 pages)
- FX-912MS (19 pages)
- s-v.p.a.m. fx-300MS (40 pages)
- fx-5800P (147 pages)
- SF-4900ER (118 pages)
- FX-991WA (38 pages)
- SF-7200SY (83 pages)
- ClassPad 300 PLUS (18 pages)
- ClassPad 330 V.3.03 (670 pages)
- ClassPad 300 Spreadsheet Application (954 pages)
- ClassPad 300 Spreadsheet Application (965 pages)
- ClassPad 300 Spreadsheet Application (753 pages)
- fx-570W (43 pages)
- fx-3950P (61 pages)