SMA SUNNY EXPLORER User Manual
Page 25
SMA Solar Technology AG
5 User Interface
User Manual
Explorer-BA-en-17
25
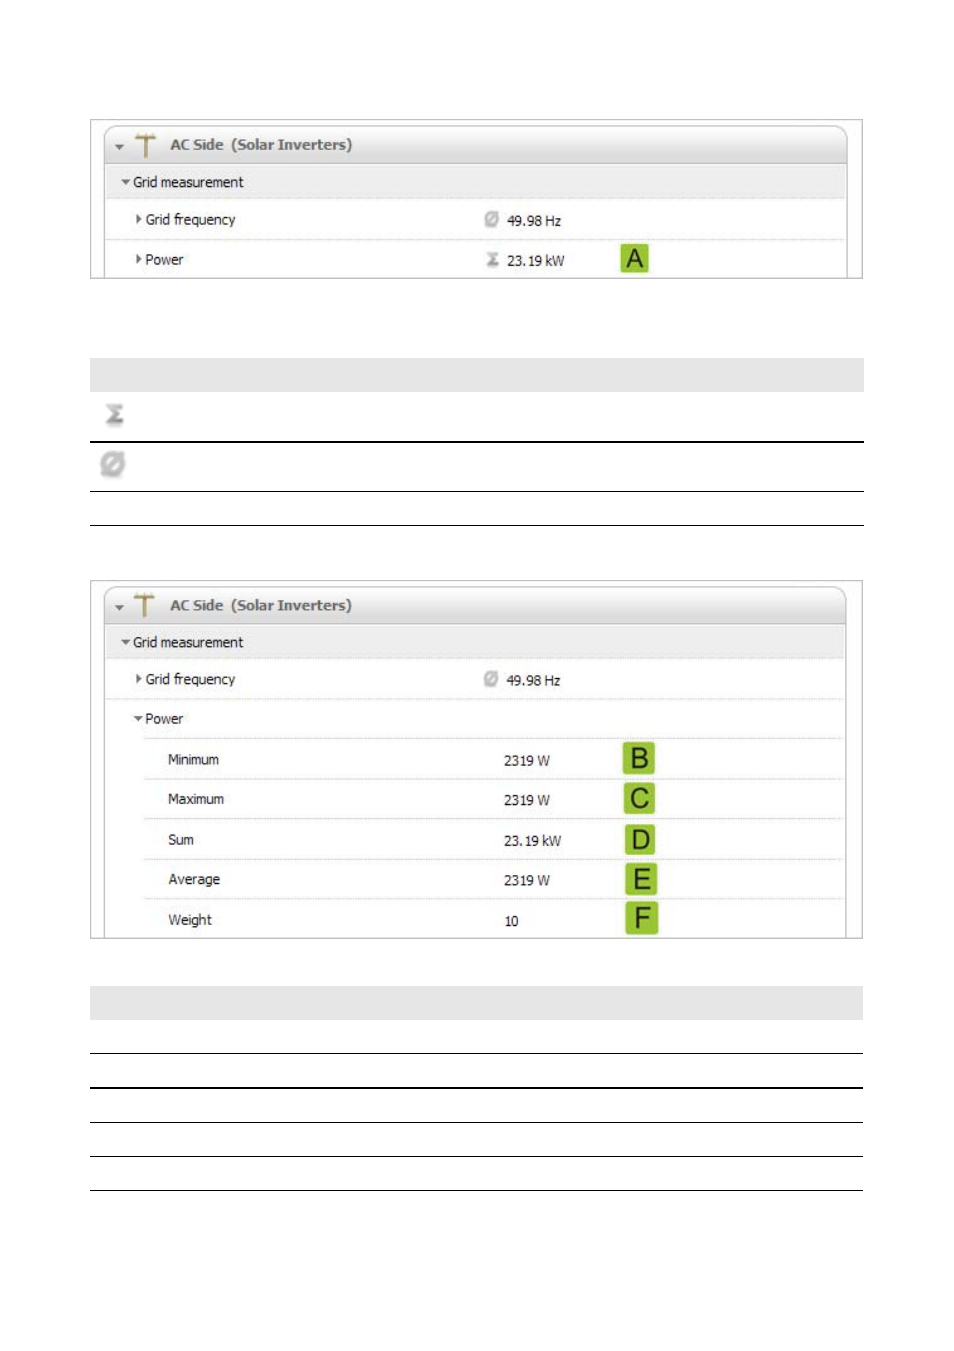
Figure 2: Sum of inverter power when the system view is selected (example)
Depending on the type of value, a meaningful aggregate for the device class is displayed:
The aggregate value can be expanded to reveal additional information.
Figure 3: Further Information on the Power value (example)
Symbol
Explanation
Total
Average value
e.g. 20°C to 50°C
Smallest and greatest value
Item
Explanation
B
Lowest power value of the ten devices
C
Highest power value of the ten devices
D
Sum of power values of the ten devices
E
Mean power value for the ten devices
F
Number of devices in the device class
See also other documents in the category SMA Equipment:
- SUNNY PORTAL (75 pages)
- SB 2.5-1VL-40 (60 pages)
- SB 2.5-1VL-40 Service Manual (36 pages)
- SB 240 (78 pages)
- FLX Pro 17 (12 pages)
- FLX Series GSM Option Kit (48 pages)
- FLX Series Sensor Interface Option (51 pages)
- FLX Series PLA Option (62 pages)
- FLX Series (248 pages)
- 25000TL (52 pages)
- 25000TL Installation (40 pages)
- 25000TL Service Manual (46 pages)
- CBL-DC-CMB8-10 (24 pages)
- 25000TL Quick Installation Guide (36 pages)
- STP 60-10 Replacing a Defective Fan (12 pages)
- STP 60-10 Replacing Defective Surge Arresters (12 pages)
- Webconnect Systems in SUNNY PORTAL (69 pages)
- STP 12000TL (68 pages)
- STP 60-US-10 Installation (232 pages)
- 485 Data Module Type B (24 pages)
- STP 12000TL Quick Installation Guide (28 pages)
- 1000-US (52 pages)
- STP 24000TL-US (78 pages)
- STP 17000TL (60 pages)
- STP 20000TL (2 pages)
- SB 6000TL Service Manual (46 pages)
- MULTIFUNCTION RELAY (32 pages)
- SB 5000TL (60 pages)
- SB 5000TL Quick Installation Guide (32 pages)
- FANKIT01-10 (24 pages)
- SB 7700TL-US (28 pages)
- FANKIT02-10 (24 pages)
- SB 7700TL-US Installation (96 pages)
- SUNNY MINI CENTRAL (48 pages)
- DC Disconnect Switch For SB 3800-U (32 pages)
- SB 4000-US (100 pages)
- DB-DC-DISCON (4 pages)
- SB 3800-U (86 pages)
- POWER BALANCER (28 pages)
- SB 8000-US (104 pages)
- SB 11000TL‑US (40 pages)
- SMC 11000TL (24 pages)
- SBCBTL6 (36 pages)
- SB 11000TL‑US Installation (92 pages)
- SMC 11000TL Installation (96 pages)