D. linearization, E. measurement display configuration, Instruction manual – Emerson NGA 2000 TO2 User Manual
Page 43
Instruction Manual
760008-A
September 2001
Rosemount Analytical Inc. A Division of Emerson Process Management
Operation 3-19
Model NGA 2000 TO2
d. Linearization
Linearization is only performed when the
sensor is changed. See section 4-3 be-
low.
e. Measurement
Display
Configuration
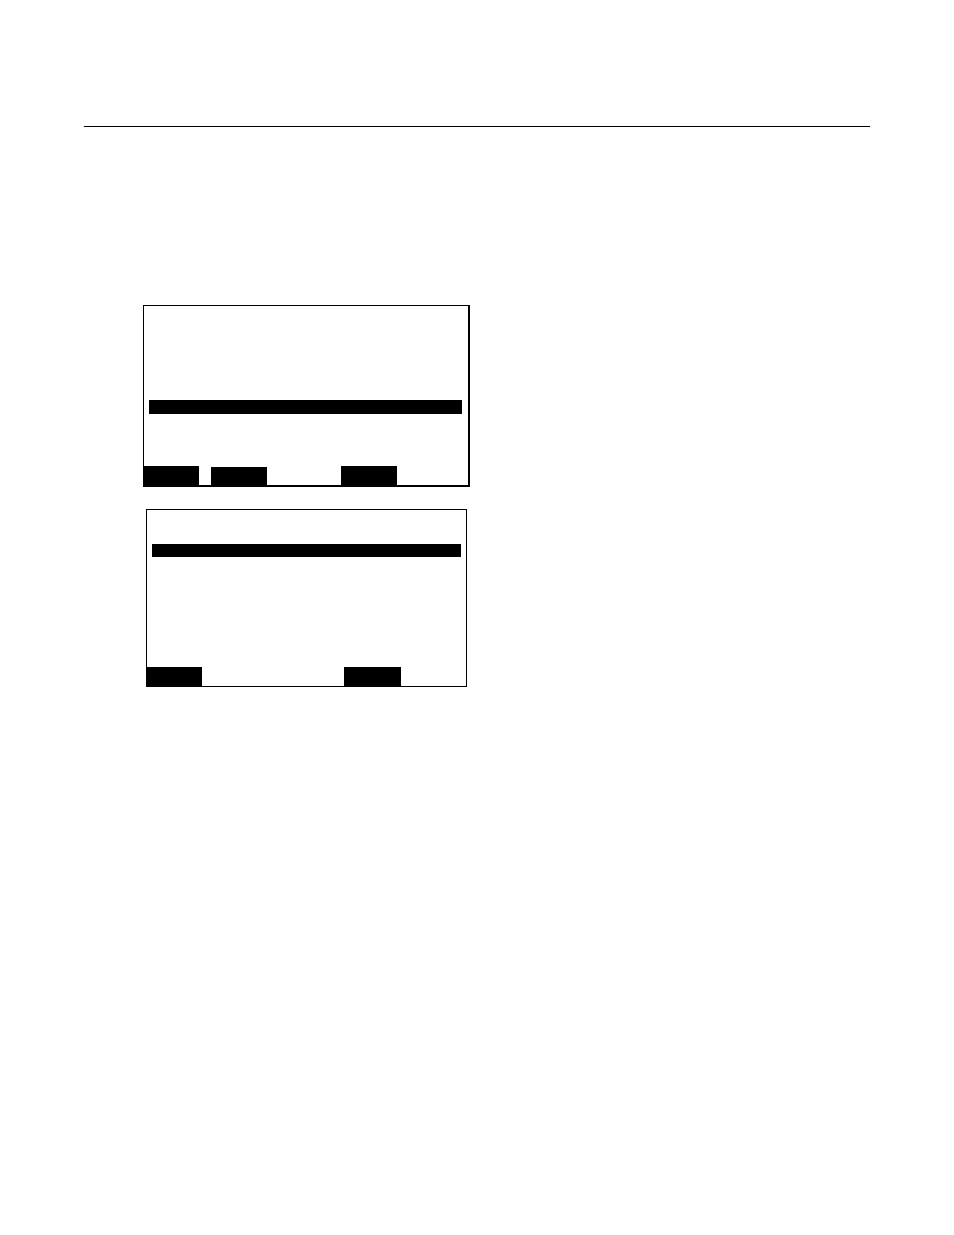
Figure 3-20. Measurement Display Configuration
The “Signal on mini-bargraph” lines are
used to set various status values that can
display on the four lines available on the
single component (Measure) display. Se-
lect a line and press the
↵ key. To change
the value use the
↑ and ↓ keys. The val-
ues will scroll through the allowable se-
lections as follows:
Electrolyte level
Displays “OK” or “Low.”
Range
Displays the range number from 1 to 4.
Sample flow
Displays the sample flow rate in ml/min with a bargraph.
Sensor current
Displays the sensor current in uA with a bargraph.
Temp. current
Displays the heater current in uA with a bargraph.
Sensor temp.
Displays the sensor temperature in
°C with a bargraph.
Validity
Not functional on the TO2.
Operation status
Not functional on the TO2.
Move the cursor to the “Measurement display
configuration…” line and press the
↵ key.
The “Measurement Display Configuration”
menu will be displayed.
The first two lines allow for setting the con-
centration value displayed precision and
number of digits.
The “Module identification tag:” line set the
displayed neumonic for the analyzer on all
display screens. Select the line and press the
↵ key to change the values using the ← and
→ keys to select a digit and then the ↑ and ↓
keys to change the value. The values will
scroll through all numbers and upper and
lowercase letters.
TO2
37.50 ppm
-- Analyzer Module Setup and Controls --
Calibration…
Alarms…
Ranges…
Linearization…
Measurement display configuration…
Concentration measurement…
Flow measurement…
Temperature measurement…
Measure
Back…
Status…
TO2
37.50 ppm
Measure
Back…
-- Measurement Display Configuration --
Displayed concentration digits: 6
Digits after decimal point: 2
Module identification tag: TO2
Signal on mini-bargraph – 1: Electrolyte level
Signal on mini-bargraph – 2: Temp current
Signal on mini-bargraph – 3: Range
Signal on mini-bargraph – 4: Sensor current