The details pane – Measurement Computing USB-5100 Series User Manual
Page 9
USB-5100 Series Software Help
Introducing USB-5100 Series
To navigate the Points Table:
Use the arrow keys or scroll bars to move up, down, left, and right in the Points Table.
Click the crosshair tool in the plot to select the corresponding point in the Points Table.
Click a value or event cell in the Points Table to display the crosshair on the graph at the time
corresponding to that cell.
To resize the pane, drag the divider between the Points Table and the plot.
To hide the Points Table, clear the
View»Points Table
checkbox option.
To hide the Points Table by default when you plot data, complete the following steps:
1. Select
File»Preferences»Plotting»Layout
.
2. Clear the
Show the points table when plotting data
checkbox.
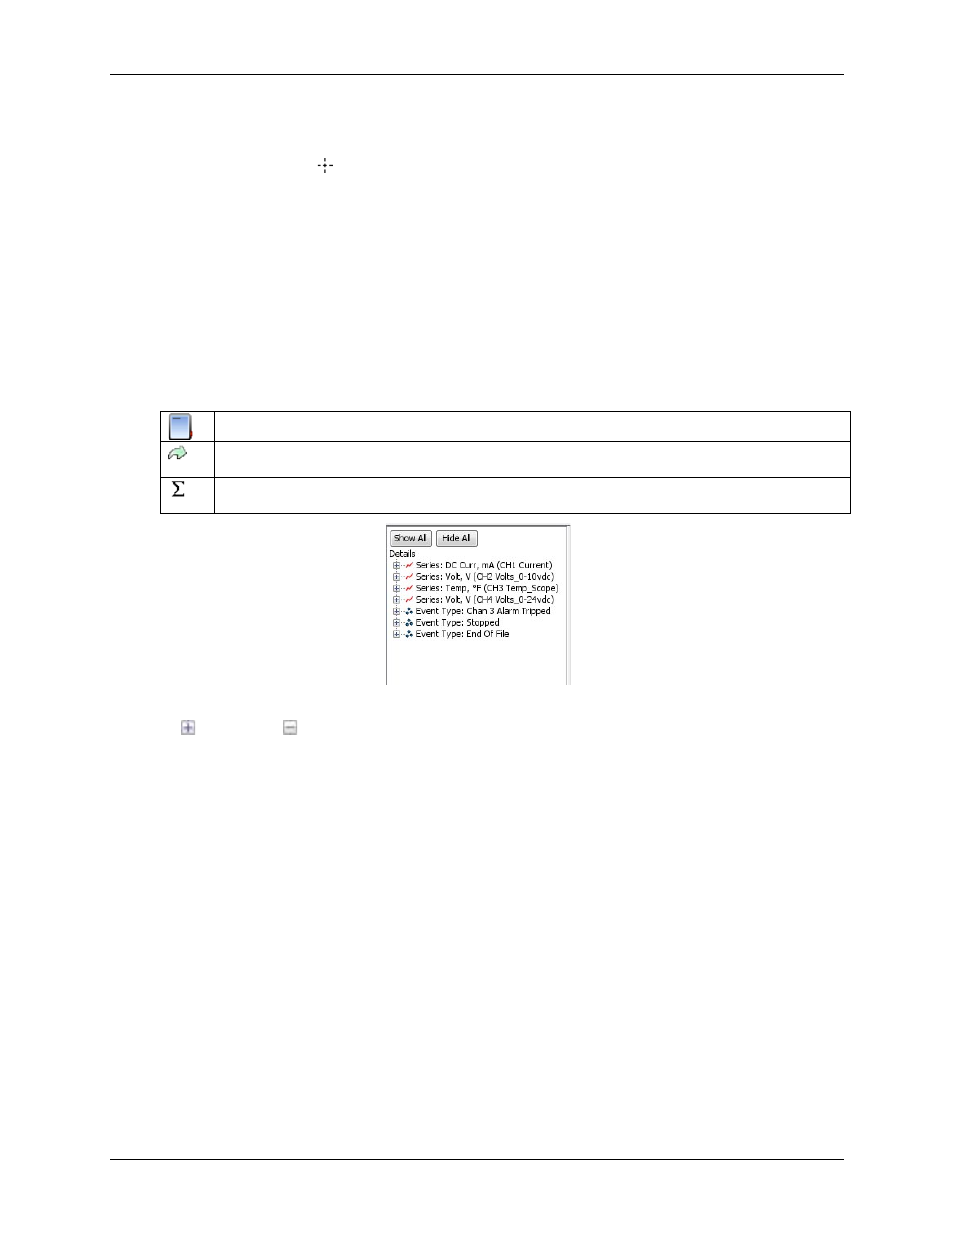
The Details Pane
The Details Pane shows information for each series and event displayed in the plot including:
Information about the devices, such as model and serial numbers.
Deployment information, such as the launch description, deployment number, start time and time zone,
logging interval, and battery voltage at launch.
Series statistics, such as the total number of sensor samples and events, time of the first and last sample, and
the maximum, minimum, average, and standard deviation for each sensor series in the plot,
Figure 3. Details Pane
Click
to expand or
to collapse an entry in the Details Pane. Click
Show All
/
Hide All
to expand or collapse
the entire details tree.
Click a series node in the details tree to select the corresponding series on the graph and corresponding column
in the Points Table.
To resize the pane, drag the divider between the Details pane and the graph.
To hide the Details Pane, clear the
View»Details Pane
checkbox option.
To hide the Points table by default when you plot data, complete the following steps:
1. Select
File»Preferences»Plotting»Layout
.
2. Clear the
Show the details table when plotting data
checkbox.
9